Ранговая корреляция.
Коэффициент ранговой корреляции Кендалла
Краткая теория
Коэффициент корреляции Кендалла
используется в случае, когда переменные представлены двумя порядковыми шкалами
при условии, что связанные ранги отсутствуют. Вычисление коэффициента Кендалла связано с подсчетом числа совпадений и инверсий.
Этот коэффициент изменяется в пределах
и рассчитывается по формуле:
Для расчета
все единицы ранжируются по признаку
;
по ряду другого признака
подсчитывается для каждого ранга число
последующих рангов, превышающий данный (их обозначим
через
),
и число последующих рангов ниже данного (их обозначим через
).
Можно показать, что
и коэффициент ранговой корреляции Кендалла
можно записать как
Для того, чтобы при уровне значимости
,
проверить нулевую гипотезу о равенстве нулю генерального коэффициента ранговой
корреляции
Кендалла при конкурирующей гипотезе
,
надо вычислить критическую точку:
где
– объем выборки;
– критическая точка двусторонней критической
области, которую находят
по таблице функции Лапласа
по равенству
Если
– нет
оснований отвергнуть нулевую гипотезу. Ранговая корреляционная связь между
признаками незначимая.
Если
– нулевую
гипотезу отвергают. Между признаками существует значимая ранговая
корреляционная связь.
Пример решения задачи
Задача
При
приеме на работу семи кандидатам на вакантные должности было предложено два
теста. Результаты тестирования (в баллах) приведены в таблице:
| Тест | Кандидат | ||||||
| 1 | 2 | 3 | 4 | 5 | 6 | 7 | |
| 1 | 31 | 82 | 25 | 26 | 53 | 30 | 29 |
| 2 | 21 | 55 | 8 | 27 | 32 | 42 | 26 |
Вычислить
ранговый коэффициент корреляции Кендалла между
результатами тестирования по двум тестам и на уровне
оценить его значимость.
Решение
На сайте можно заказать решение контрольной или самостоятельной работы, домашнего задания, отдельных задач. Для этого вам нужно только связаться со мной:
ВКонтакте
WhatsApp
Telegram
Мгновенная связь в любое время и на любом этапе заказа. Общение без посредников. Удобная и быстрая оплата переводом на карту СберБанка. Опыт работы более 25 лет.
Подробное решение в электронном виде (docx, pdf) получите точно в срок или раньше.
Вычислим коэффициент
Кендалла. Ранги
факторного признака
располагаются строго в порядке возрастания и
параллельно записываются соответствующие им ранги результативного признака
. Для каждого
ранга
из числа следующих за ним рангов
подсчитывается количество больших него по величине рангов (заносится в столбец
) и число рангов,
меньших по значению (заносится в столбец
).
Искомый коэффициент корреляции Кендалла:
Вычислим
критическую точку:
-коэффициент
корреляции незначим
Вывод к задаче
Таким
образом взаимосвязь между результатами тестирования по
двум тестам является достаточно слабой.
Коэффициент
корреляции Кендалла используется в
случае, когда переменные представлены
двумя порядковыми шкалами при условии,
что связанные ранги отсутствуют.
Вычисление коэффициента Кендалла
связано с подсчетом числа совпадений
и инверсий. Рассмотрим эту процедуру
на примере предыдущей задачи.
Алгоритм
решения задачи следующий:
-
Переоформляем
данные табл. 8.5 таким образом, чтобы
один из рядов (в данном случае ряд xi)
оказался ранжированным. Другими словами,
мы переставляем пары x
и y
в
нужном порядке и
вносим
данные в столбцы 1 и 2 табл. 8.6.
Таблица
8.6
|
xi |
yi |
Совп. |
Инв. |
|
1 2 3 4 5 6 7 8 9 10 11 12 |
3 6 7 1 2 4 9 5 11 8 12 10 |
9 6 5 8 7 6 3 4 1 2 0 0 |
2 4 4 0 0 0 2 0 2 0 1 0 |
|
Σ |
51 |
15 |
2.
Определяем «степень ранжированности»
2-го ряда (yi).
Эта процедура проводится в следующей
последовательности:
а)
берем первое значение неранжированного
ряда «3». Подсчитываем количество рангов
ниже
данного числа, которые больше
сравниваемого значения. Таких значений
9 (числа 6, 7, 4, 9, 5, 11, 8, 12 и 10). Заносим число
9 в столбец «совпадения». Затем подсчитываем
количество значений, которые меньше
трех. Таких значений 2 (ранги 1 и 2); вносим
число 2 в графу «инверсии».
б)
отбрасываем число 3 (мы с ним уже
поработали) и повторяем процедуру для
следующего значения «6»: число совпадений
равно 6 (ранги 7, 9, 11, 8, 12 и 10), число инверсий
– 4 (ранги 1, 2, 4 и 5). Вносим число 6 в графу
«совпадения», а число 4 – в графу
«инверсии».
в)
аналогичным образом процедура повторяется
до конца ряда; при этом следует помнить,
что каждое «отработанное» значение
исключается из дальнейшего рассмотрения
(подсчитываются только ранги, которые
лежат ниже данного числа).
Примечание
Для
того чтобы не совершать ошибок в
подсчетах, следует иметь в виду, что с
каждым «шагом» сумма совпадений и
инверсий уменьшается на единицу; это
понятно, если учесть, что каждый раз
одно значение исключается из рассмотрения.
3. Подсчитывается сумма
совпадений (Р)
и сумма инверсий (Q);
данные вносятся в одну и трех
взаимозаменяемых формул коэффициента
Кендалла (8.10). Проводятся соответствующие
вычисления.
t
![]()
(8.10)
![]() В
В
нашем случае:
В табл. XIV
Приложений находятся критические
значения коэффициента для данной
выборки: τкр.
= 0,45; 0,59. Эмпирически полученное значение
сравнивается с табличным.
Вывод
τ = 0,55 > τкр.
= 0,45. Корреляция статистически значима
для 1-го уровня.
Примечание:
При необходимости
(например, при отсутствии таблицы
критических значений) статистическая
значимость t
Кендалла может быть определена по
формуле следующего вида:
 (8.11)
где S*
= P – Q + 1, если P
< Q, и S*
= P – Q – 1, если
P > Q.
Значения
z
для соответствующего уровня значимости
соответствуют мере Пирсона и находятся
по соответствующим таблицам (в приложение
не включены. Для стандартных уровней
значимости zкр
= 1,96 (для β1
= 0,95) и 2,58 (для β2
= 0,99). Коэффициент корреляции Кендалла
является статистически значимым, если
z
> zкр
В
нашем случае S*
= P – Q
– 1 = 35 и z
=
2,40, т. е. первоначальный вывод подтверждается:
корреляция между признаками статистически
достоверна для 1-го уровня значимости.
Соседние файлы в предмете [НЕСОРТИРОВАННОЕ]
- #
- #
23.02.201514.96 Mб37Longman_Advanced_Learners_39_Grammar.pdf
- #
- #
- #
- #
- #
- #
- #
- #
- #
From Wikipedia, the free encyclopedia
“Tau-a” redirects here. For the astronomical radio source, see Taurus A.
“Tau coefficient” redirects here. Not to be confused with Tau distribution.
In statistics, the Kendall rank correlation coefficient, commonly referred to as Kendall’s τ coefficient (after the Greek letter τ, tau), is a statistic used to measure the ordinal association between two measured quantities. A τ test is a non-parametric hypothesis test for statistical dependence based on the τ coefficient.
It is a measure of rank correlation: the similarity of the orderings of the data when ranked by each of the quantities. It is named after Maurice Kendall, who developed it in 1938,[1] though Gustav Fechner had proposed a similar measure in the context of time series in 1897.[2]
Intuitively, the Kendall correlation between two variables will be high when observations have a similar (or identical for a correlation of 1) rank (i.e. relative position label of the observations within the variable: 1st, 2nd, 3rd, etc.) between the two variables, and low when observations have a dissimilar (or fully different for a correlation of −1) rank between the two variables.
Both Kendall’s 

Definition[edit]

All points in the gray area are concordant and all points in the white area are discordant with respect to point 


Let 


The Kendall τ coefficient is defined as:
[3]
Where 
Properties[edit]
The denominator is the total number of pair combinations, so the coefficient must be in the range −1 ≤ τ ≤ 1.
- If the agreement between the two rankings is perfect (i.e., the two rankings are the same) the coefficient has value 1.
- If the disagreement between the two rankings is perfect (i.e., one ranking is the reverse of the other) the coefficient has value −1.
- If X and Y are independent and not constant, then the expectation of the coefficient is zero.
- An explicit expression for Kendall’s rank coefficient is
.
Hypothesis test[edit]
The Kendall rank coefficient is often used as a test statistic in a statistical hypothesis test to establish whether two variables may be regarded as statistically dependent. This test is non-parametric, as it does not rely on any assumptions on the distributions of X or Y or the distribution of (X,Y).
Under the null hypothesis of independence of X and Y, the sampling distribution of τ has an expected value of zero. The precise distribution cannot be characterized in terms of common distributions, but may be calculated exactly for small samples; for larger samples, it is common to use an approximation to the normal distribution, with mean zero and variance
.[4]
Accounting for ties[edit]
A pair 


Tau-a[edit]
The Tau-a statistic tests the strength of association of the cross tabulations. Both variables have to be ordinal. Tau-a will not make any adjustment for ties. It is defined as:
where nc, nd and n0 are defined as in the next section.
Tau-b[edit]
The Tau-b statistic, unlike Tau-a, makes adjustments for ties.[5] Values of Tau-b range from −1 (100% negative association, or perfect inversion) to +1 (100% positive association, or perfect agreement). A value of zero indicates the absence of association.
The Kendall Tau-b coefficient is defined as:
where
A simple algorithm developed in BASIC computes Tau-b coefficient using an alternative formula. [6]
Be aware that some statistical packages, e.g. SPSS, use alternative formulas for computational efficiency, with double the ‘usual’ number of concordant and discordant pairs.[7]
Tau-c[edit]
Tau-c (also called Stuart-Kendall Tau-c)[8] is more suitable than Tau-b for the analysis of data based on non-square (i.e. rectangular) contingency tables.[8][9] So use Tau-b if the underlying scale of both variables has the same number of possible values (before ranking) and Tau-c if they differ. For instance, one variable might be scored on a 5-point scale (very good, good, average, bad, very bad), whereas the other might be based on a finer 10-point scale.
The Kendall Tau-c coefficient is defined as:[9]
where
Significance tests[edit]
When two quantities are statistically dependent, the distribution of 


Thus, to test whether two variables are statistically dependent, one computes 

Numerous adjustments should be added to 


where
This is sometimes referred to as the Mann-Kendall test.[10]
Algorithms[edit]
The direct computation of the numerator 
numer := 0
for i := 2..N do
    for j := 1..(i − 1) do
        numer := numer + sign(x[i] − x[j]) × sign(y[i] − y[j])
return numer
Although quick to implement, this algorithm is 

Begin by ordering your data points sorting by the first quantity, 


where 


A Merge Sort partitions the data to be sorted, 


where 


function M(L[1..n], R[1..m]) is
    i := 1
    j := 1
    nSwaps := 0
    while i ≤ n and j ≤ m do
        if R[j] < L[i] then
            nSwaps := nSwaps + n − i + 1
            j := j + 1
        else
            i := i + 1
    return nSwaps
A side effect of the above steps is that you end up with both a sorted version of 


Software Implementations[edit]
- R’s statistics base-package implements the test
cor.test(x, y, method = "kendall")in its “stats” package (alsocor(x, y, method = "kendall")will work, but the latter does not return the p-value). - For Python, the SciPy library implements the computation of
in
scipy.stats.kendalltau
See also[edit]
- Correlation
- Kendall tau distance
- Kendall’s W
- Spearman’s rank correlation coefficient
- Goodman and Kruskal’s gamma
- Theil–Sen estimator
- Mann–Whitney U test – it is equivalent to Kendall’s tau correlation coefficient if one of the variables is binary.
References[edit]
- ^ Kendall, M. (1938). “A New Measure of Rank Correlation”. Biometrika. 30 (1–2): 81–89. doi:10.1093/biomet/30.1-2.81. JSTOR 2332226.
- ^ Kruskal, W. H. (1958). “Ordinal Measures of Association”. Journal of the American Statistical Association. 53 (284): 814–861. doi:10.2307/2281954. JSTOR 2281954. MR 0100941.
- ^ Nelsen, R.B. (2001) [1994], “Kendall tau metric”, Encyclopedia of Mathematics, EMS Press
- ^ Prokhorov, A.V. (2001) [1994], “Kendall coefficient of rank correlation”, Encyclopedia of Mathematics, EMS Press
- ^ Agresti, A. (2010). Analysis of Ordinal Categorical Data (Second ed.). New York: John Wiley & Sons. ISBN 978-0-470-08289-8.
- ^ Alfred Brophy (1986). “An algorithm and program for calculation of Kendall’s rank correlation coefficient” (PDF). Behavior Research Methods, Instruments, & Computers. 18: 45–46. doi:10.3758/BF03200993. S2CID 62601552.
- ^ IBM (2016). IBM SPSS Statistics 24 Algorithms. IBM. p. 168. Retrieved 31 August 2017.
- ^ a b Berry, K. J.; Johnston, J. E.; Zahran, S.; Mielke, P. W. (2009). “Stuart’s tau measure of effect size for ordinal variables: Some methodological considerations”. Behavior Research Methods. 41 (4): 1144–1148. doi:10.3758/brm.41.4.1144. PMID 19897822.
- ^ a b Stuart, A. (1953). “The Estimation and Comparison of Strengths of Association in Contingency Tables”. Biometrika. 40 (1–2): 105–110. doi:10.2307/2333101. JSTOR 2333101.
- ^ Glen_b. “Relationship between Mann-Kendall and Kendall Tau-b”.
- ^ Knight, W. (1966). “A Computer Method for Calculating Kendall’s Tau with Ungrouped Data”. Journal of the American Statistical Association. 61 (314): 436–439. doi:10.2307/2282833. JSTOR 2282833.
Further reading[edit]
- Abdi, H. (2007). “Kendall rank correlation” (PDF). In Salkind, N.J. (ed.). Encyclopedia of Measurement and Statistics. Thousand Oaks (CA): Sage.
- Daniel, Wayne W. (1990). “Kendall’s tau”. Applied Nonparametric Statistics (2nd ed.). Boston: PWS-Kent. pp. 365–377. ISBN 978-0-534-91976-4.
- Kendall, Maurice; Gibbons, Jean Dickinson (1990) [First published 1948]. Rank Correlation Methods. Charles Griffin Book Series (5th ed.). Oxford: Oxford University Press. ISBN 978-0195208375.
- Bonett, Douglas G.; Wright, Thomas A. (2000). “Sample size requirements for estimating Pearson, Kendall, and Spearman correlations”. Psychometrika. 65 (1): 23–28. doi:10.1007/BF02294183. S2CID 120558581.
External links[edit]
- Tied rank calculation
- Software for computing Kendall’s tau on very large datasets
- Online software: computes Kendall’s tau rank correlation
В статистике корреляция относится к силе и направлению связи между двумя переменными. Значение коэффициента корреляции может варьироваться от -1 до 1, где -1 указывает на полную отрицательную связь, 0 указывает на отсутствие связи и 1 указывает на полную положительную связь.
Наиболее часто используемым коэффициентом корреляции является коэффициент корреляцииПирсона , который измеряет линейную связь между двумя числовыми переменными.
Одним из менее часто используемых коэффициентов корреляции является Тау Кендалла , который измеряет взаимосвязь между двумя столбцами ранжированных данных.
Формула для расчета тау Кендалла, часто обозначаемая аббревиатурой τ, выглядит следующим образом:
τ = (CD) / (C+D)
куда:
C = количество согласных пар
D = количество несогласующихся пар
В следующем примере показано, как использовать эту формулу для вычисления коэффициента ранговой корреляции Тау Кендалла для двух столбцов ранжированных данных.
Пример расчета тау Кендалла
Предположим, два тренера по баскетболу ранжируют 12 своих игроков от худшего к лучшему. В следующей таблице показаны рейтинги, которые каждый тренер присвоил игрокам:
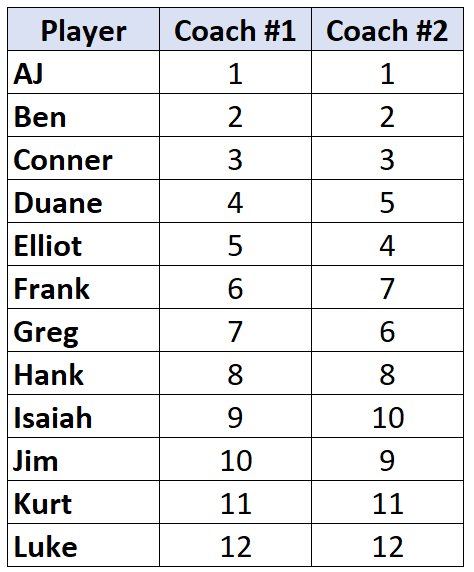
Поскольку мы работаем с двумя столбцами ранжированных данных, уместно использовать Тау Кендалла для расчета корреляции между рейтингами двух тренеров. Используйте следующие шаги для расчета Тау Кендалла:
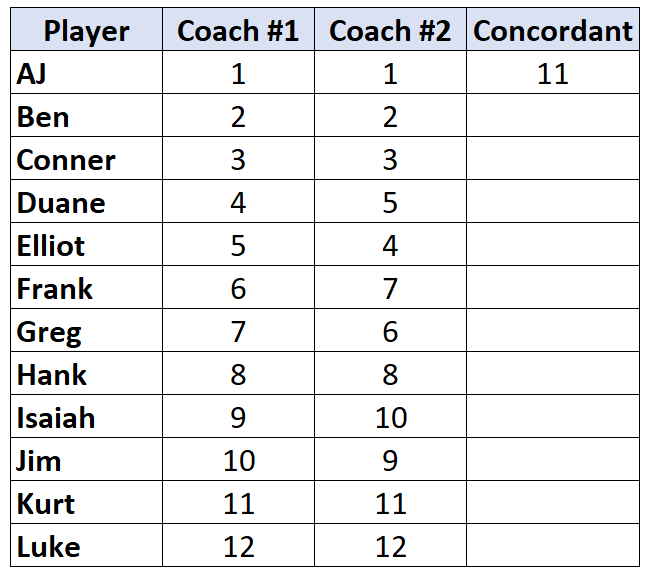
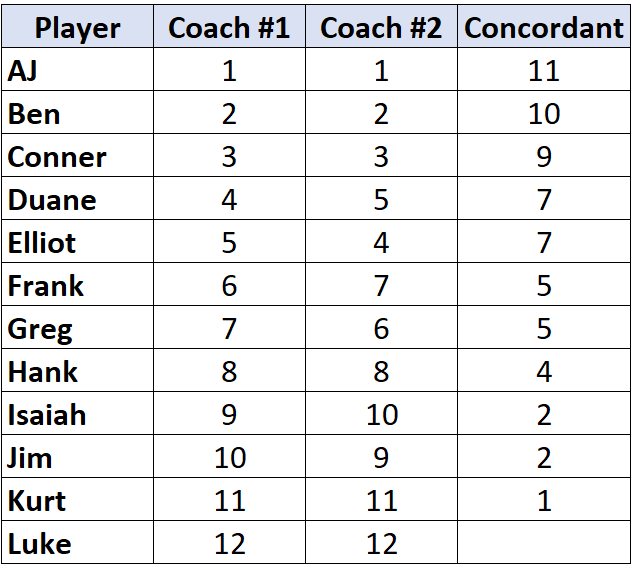
Шаг 1: Подсчитайте количество согласных пар.
Посмотрите только на ранги тренера №2. Начиная с первого игрока, посчитайте, на сколько рядов ниже него больше.Например, ниже «1» есть 11 чисел, которые больше, поэтому мы напишем 11:
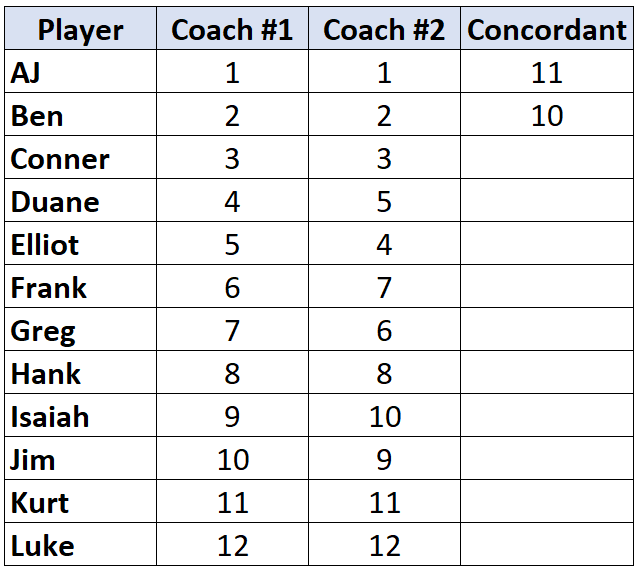
Перейдите к следующему игроку и повторите процесс. Ниже «2» есть 10 чисел, которые больше, поэтому мы напишем 10:
Как только мы достигаем игрока, чей ранг меньше , чем у игрока до него, мы просто присваиваем ему то же значение, что и у игрока до него. Например, у Эллиота ранг «4», что меньше ранга предыдущего игрока «5», поэтому мы просто присваиваем ему то же значение, что и игроку до него:
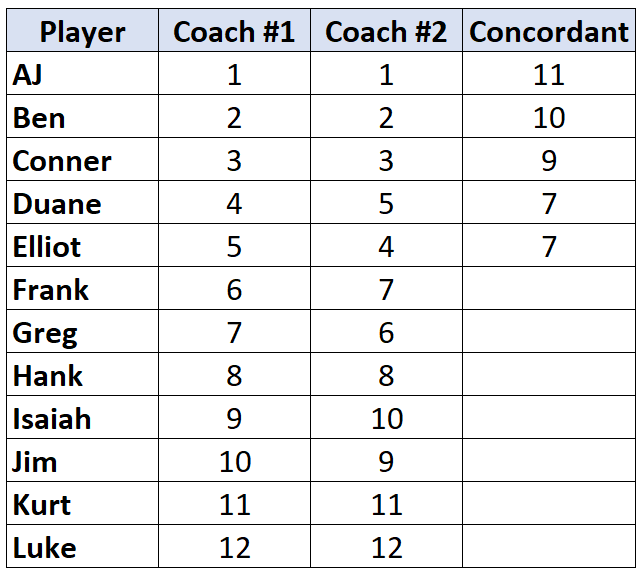
Повторите этот процесс для всех игроков:
Шаг 2: Подсчитайте количество несогласующихся пар.
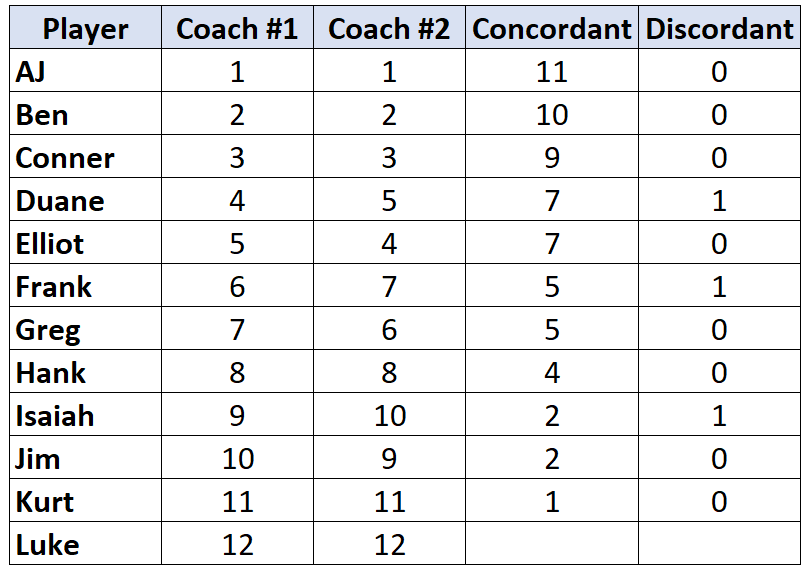
Опять же, смотрите только на ранги тренера №2. Для каждого игрока посчитайте, на сколько рангов под ним меньше.Например, тренер № 2 присвоил AJ ранг «1», и ниже него нет игроков с меньшим рангом. Таким образом, мы присваиваем ему значение 0:
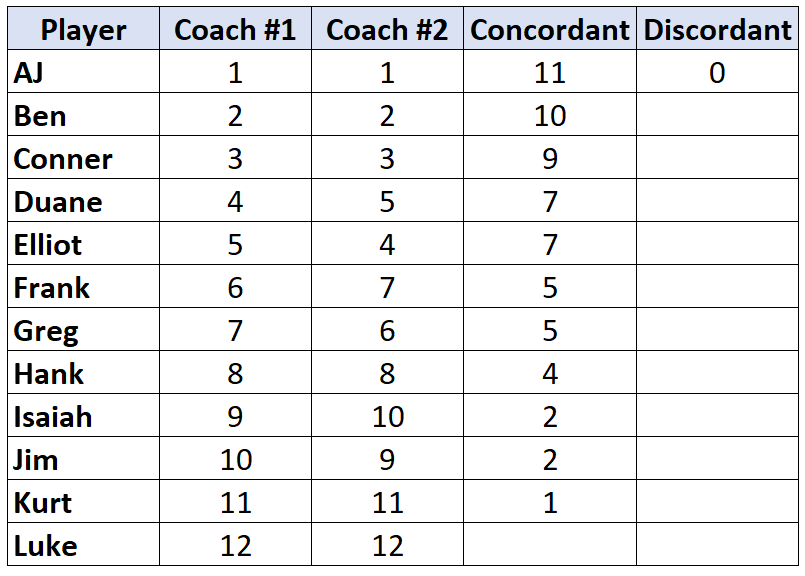
Повторите этот процесс для каждого игрока:
Шаг 3: Подсчитайте сумму каждого столбца и найдите Тау Кендалла.
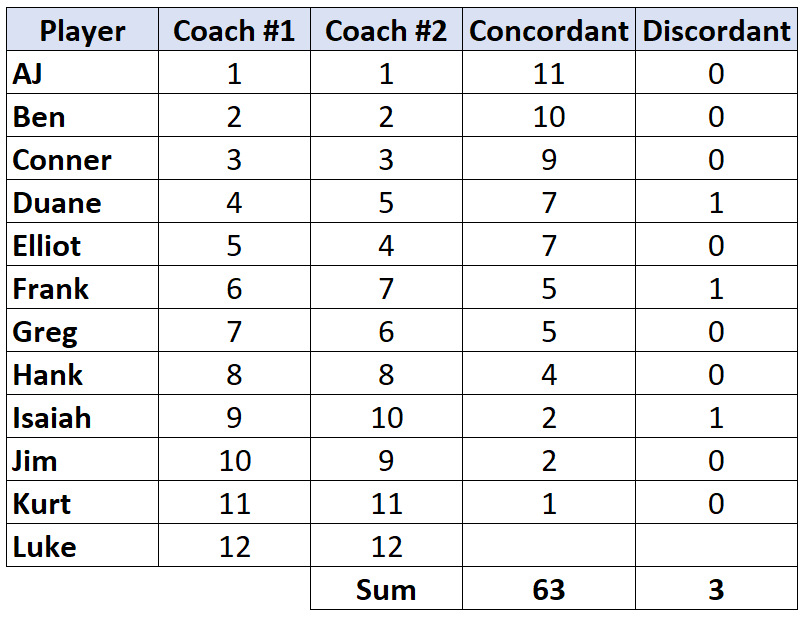
Тау Кендалла = (CD) / (C+D) = (63-3) / (63+3) = (60/66) = 0,909 .
Статистическая значимость тау Кендалла
Когда у вас более n = 10 пар, тау Кендалла обычно следует нормальному распределению. Вы можете использовать следующую формулу для расчета z-показателя тау Кендалла:
z = 3τ * √ n (n-1) / √ 2 (2n + 5)
куда:
τ = значение, которое вы рассчитали для Тау Кендалла
n = количество пар
Вот как вычислить z для предыдущего примера:
z = 3(0,909)*√12 (12-1) /√2 (2*12+5) = 4,11 .
Используя калькулятор Z-оценки для P-значения , мы видим, что p-значение для этой z-оценки составляет 0,00004 , что является статистически значимым при альфа-уровне 0,05. Таким образом, существует статистически значимая корреляция между рангами, которые два тренера присвоили игрокам.
Бонус: как рассчитать Тау Кендалла в R
В статистическом программном обеспечении R вы можете использовать функцию kendall.tau() из библиотеки VGAM для вычисления Тау Кендалла для двух векторов, которая использует следующий синтаксис:
kendall.tau(x, y)
где x и y — два числовых вектора одинаковой длины.
Следующий код иллюстрирует, как рассчитать Тау Кендалла для точных данных, которые мы использовали в предыдущем примере:
#load *VGAM*library(VGAM)

#create vector for each coach's rankings
coach_1 <- c(1, 2, 3, 4, 5, 6, 7, 8, 9, 10, 11, 12)
coach_2 <- c(1, 2, 3, 5, 4, 7, 6, 8, 10, 9, 11, 12)

#calculate Kendall's Tau
kendall.tau(coach_1, coach_2)

#[1] 0.9090909
Обратите внимание, как значение Тау Кендалла совпадает со значением, рассчитанным нами вручную.


