поделиться знаниями или
запомнить страничку
- Все категории
-
экономические
43,651 -
гуманитарные
33,653 -
юридические
17,917 -
школьный раздел
611,893 -
разное
16,900
Популярное на сайте:
Как быстро выучить стихотворение наизусть? Запоминание стихов является стандартным заданием во многих школах.
Как научится читать по диагонали? Скорость чтения зависит от скорости восприятия каждого отдельного слова в тексте.
Как быстро и эффективно исправить почерк? Люди часто предполагают, что каллиграфия и почерк являются синонимами, но это не так.
Как научится говорить грамотно и правильно? Общение на хорошем, уверенном и естественном русском языке является достижимой целью.
С учетом общего контектса и того кто сейчас находится с визитом в России хочу вспомнить одну вечную страшилку.
Китай вот-вот захватит Сибирь! Дальний Восток, Москву и Пекин! Неа, я не опечатался в последнем. Ибо абсурдность перечисления примерно такая же, как и сама страшилка.
Ответ на которую настолько простой, что порой даешься диву, как все гениально и просто.
Начнем с загадки. Что, чаще всего, говорят на Западе после того, как получат на орехи? Верно! Мороз вмешался!
Вот тут этот ответ, как раз правдив. Для Японии и Китая наши восточные регионы слишком холодные! Не могут они в таких условиях жить и потому они им просто не нужны! Их не заселить!
Посмотрим карту плотности населения.
Как видите, чем севернее тем плотность населения ниже. Вообще едва-ли не половина Японцев сосредоточена в черных областях. Известные острова это старая фантомная боль и не больше, причем больше желание США связанное с нашим Тихоокеанским флотом.
Аналогичная ситуация с КНР. Плотность их населения стремится на юг. Вообще одна из основных проблем Китая это миграция из северных и центральных провинций в южные. Как у нас переезд в Москву из регионов. Хотя в последние годы проблема, в целом, идет на спад. Если судить по открытым источникам информации.
Карта температурных зон Евразии. И если посмотреть на азиатскую часть и сопоставить с картами Японии, Китая, плотностью их населения они совпадут. Чем южнее и темплее тем людей больше.
Вот так будет даже нагляднее. Температуры в КНР
И еще раз для большей наглядности
Уверен в скором времени мы услышим много новых-старых басен о бесполезном, то есть о главном, о том что у нас весь Байкал выпили. Но, как показывает практика, на Востоке нам рады. Проблемы у нас только от Запада. На Востоке одна больная точка есть, но она досадила слишком многим и ей бы к нам под зонтик бежать, а не брыкаться. Впрочем, страна та оккупированная и с нее спросу, как с Олафа колбасы.
А мы идем на восток!
Подписывайтесь на блог и канал телеграмм! Ставьте лайки и комментируйте. Это помогает развитию канала. Спасибо!)
Опубликовано:
09 февраля 2018, 18:47

Проблема перенаселения — это не байка ученых для выманивания грантов, а реальная опасность, с которой уже столкнулись некоторые страны. Яркий пример — КНР. Плотность населения Китая вынудила правительство ввести жесткие демографические ограничения. Почему им пришлось это сделать? Давайте разберемся.
Плотность населения Китая на квадратный километр
На начало 2018 года население Китайской Народной Республики составляет 1,395 млн человек. Это почти 20% от суммарного количества людей на планете.
Ежегодный прирост варьируется от 0,45 до 0,6%. В сравнении с другими странами это немного, но в абсолютном выражении население Китая каждый год увеличивается почти на целый Казахстан.
В среднем каждые две секунды на Земле становится на одного китайца больше, при этом рождаемость почти в два раза превышает смертность. Стоит учесть, что развитие этих показателей сдерживается жесткой демографической политикой:
- Не больше одного ребенка на семью.
- Огромные штрафы за превышение лимита.
- Дополнительные налоги для граждан, имеющих более одного ребенка.
Примечание: на национальные меньшинства данные ограничения не распространяются. Если в китайской семье после первого ребенка родилась девочка, налог за нее не взимается, так как в стране наблюдается недостаток женщин.

Если по численности населения Китай впереди планеты всей, то по показателю плотности этого нельзя сказать. Но это только на первый взгляд.
Статистика говорит, что средняя плотность населения равна 140 чел/кв. км. Это меньше, чем в Швейцарии или крохотном Люксембурге, где проживает меньше 500 тысяч человек. К слову, в соседней Индии и Японии на квадратном километре живет в два раза больше людей.
Как такое возможно? Все просто: средние показатели не отражают полной картины. В Китае есть места, где вы пройдете сотни километров, прежде чем кого-то встретите, однако в некоторых регионах такое чувство, что находишься в вечной очереди.
Читайте также: Китайские исторические фильмы про войну
Плотность населения Китая по регионам: карта
Население в Китае распределено неравномерно. Это большая страна с несколькими часовыми поясами и разнообразными климатическими условиям. Кроме того, в некоторых регионах селиться выгоднее по экономическим соображениям.
Судя по карте, в КНР еще достаточно места, но вряд ли кто-то предпочтет жизнь в горах Тибета перспективам большого города. Также на территории страны расположены две крупные пустыни, где условия, мягко говоря, не комфортные.

В северных и западных провинциях живет около 6% населения, остальные люди расселились в центральной и восточной части страны. Как и прежде, наиболее привлекательные районы лежат на плодородных равнинах и близ полноводных рек.
Вот пять самых густонаселенных провинций Китая:
- Цзянсу — 800,32 чел./кв. км;
- Шаньдун — 613,2 чел./кв. км;
- Гуандун — 584,86 чел./кв. км;
- Хэнань — 565,35 чел./кв. км;
- Чжэнцзян — 513,08 чел./кв. км.
Среди регионов с особым статусом и крупнейших городов лидерство удерживает Макао, где на квадратный километр приходится более двадцати тысяч человек. Даже представить сложно, насколько там тесно.

В Гонконге дышится свободнее, если можно так выразиться о городе, где на каждом квадратном метре находится почти семь китайцев. В Шанхае и Пекине места больше с показателями плотности 3809 и 1292 чел./кв. км соответственно.
Тем, кто интересуется, сколько людей в Китае, нужно знать, что численность населения — это не самое страшное. Важнее плотность. Если в Макао единовременно окажутся все его жители, там будет практически невозможно упасть: кто-то обязательно подхватит.
Демографические проблемы Китая наглядно показывают несовершенство жизнеустройства на Земле. Если вовремя не принять меры, то через несколько сотен, а может, и десятков лет мы подойдем к точке невозврата. Надеемся, что апокалиптическое будущее останется лишь фантазией конспирологов.
Читайте также: Конфуций: цитаты о жизни
Оригинал статьи: https://www.nur.kz/family/school/1716166-plotnost-naselenia-kitaa-po-regionam/
Счетчик населения Китая
|
1 461 693 536 |
Численность населения |
|
758 885 302 |
Численность мужского населения (51.9%) |
|
702 808 234 |
Численность женского населения (48.1%) |
|
6 671 258 |
Рождено в этом году |
|
21 123 |
Рождено сегодня |
|
3 754 597 |
Умерло в этом году |
|
11 888 |
Умерло сегодня |
|
-145 027 |
Мигрировало в этом году |
|
-459 |
Мигрировало сегодня |
|
2 771 634 |
Рост численности населения в этом году |
|
8 776 |
Рост численности населения сегодня |
15-05-2023 09:12:43
Источник : Департамент по экономическим и социальным вопросам ООН: Отдел народонаселения  .
.
Ежедневная статистика COVID-19
Уведомление касательно COVID-19!
Данные, представленные на этом сайте не отражают реальную миграционную картину, в связи с ограничением передвижения,
введённым большинством стран мира из-за пандемии коронавирусной инфекции COVID-19.
Содержание
- Счетчик населения
- Население в 2023году
- Демография в 2022 году
- Плотность населения
- Религиозные убеждения
- Возрастно-половая пирамида
- Коэффициент демографической нагрузки
- Коэффициент детской нагрузки
- Коэффициент пенсионной нагрузки
- Продолжительность жизни
- Грамотность населения
- История населения
- Прогноз численности населения
Факты о населении Китая
| Население на сегодняшний день |
| 1 461 684 760 |
| Рейтинг страны по населению |
| 1 (18.08% от населения Земли) |
| Площадь |
| 9 598 089 км2 |
| Плотность населения |
| 152.3 на км2 |
| Соотношение полов |
| 1.08 (758 885 302 мужчин на 702 808 234 женщин) |
| Средний возраст |
| 37.0 |
| Ожидаемая продолжительность жизни |
| 74.7 (72.7 – мужчины, 76.9 – женщины) |
| Грамотность населения |
| 96.4 % |
(Число людей рассчитано Countrymeters (countrymeters.info)
на основе последних данных, опубликованных отделом народонаселения ООН)
Население Китая в 2023 году
В 2023 году численность населения Китая увеличится на 7 528 037 человек и в конце года будет составлять 1 466 449 939 человек. Естественный прирост населения будет положительным и составит 7 921 946 человек. За весь год родится примерно 18 119 810 детей и умрёт 10 197 864 человека. Если уровень внешней миграции останется на уровне прошлого года,
то в следствии миграционных причин численность населения изменится на -393 909 человек. То есть, суммарное количество людей, покидающих страну (эмигрантов) будет преобладать над количеством людей,
въезжающих в страну с целью долгосрочного пребывания (иммигрантов).
Динамика изменения численности населения Китая в 2023 году
Ниже представлены коэффициенты изменения численности населения Китая, рассчитанные нами для 2023 года:
- Рождаемость: в среднем 49 643 ребёнка в день (2 068.47 в час)
- Смертность: в среднем 27 939 человек в день (1 164.14 в час)
- Миграционный прирост населения: в среднем -1 079 человек в день (-44.97 в час)
Скорость прироста населения Китая в 2023 году будет 20 625 человека в день.
Население Китая 2022
Согласно нашей оценке, на конец 2022 года, население Китая составляло 1 458 921 902 человека. За 2022 год население Китая увеличилось приблизительно на 7 489 392 человека. Учитывая, что население Китая в начале года оценивалось в 1 451 432 510 человек, годовой прирост составил 0.52 %.
Вот основные демографические показатели Китая за 2022 год:
- Родившихся: 18 026 792 человек
- Умерших: 10 145 513 человек
- Естественный прирост населения: 7 881 279 человек
- Миграционный прирост населения: -391 887 человек
- Мужчин: 757 446 319 человек (по оценке на 31 декабря 2022 года)
- Женщин: 701 475 583 человека (по оценке на 31 декабря 2022 года)
Прирост населения 1952 – 2023
Плотность населения Китая
Согласно данным Департамента Статистики Организации Объеденённых Наций, общая площадь Китая
составляет 9 598 089 квадратных километров.
Под общей площадью подразумевается площадь суши и площадь всех водных поверхностей государства в пределах международных границ.
Плотность населения считается как отношение общей численности населения, проживающей на данной территории, к общей площади этой территории.
Согласно нашим рассчётам на начало 2023 года население Китая составляло приблизительно 1 458 921 902 человека.
Таким образом, плотность населения Китая равна 152.0 человека на квадратный километр.
Религия в Китае
| Религия | Количество последователей | Процент от общей численности населения |
|---|---|---|
| Нерелигиозные и атеисты | 762 999 445 | 52.2 % |
| Народные верования | 320 108 962 | 21.9 % |
| Буддизм | 266 026 626 | 18.2 % |
| Христианство | 74 545 923 | 5.1 % |
| Ислам | 26 310 326 | 1.8 % |
| Другие | 11 693 478 | 0.8 % |
Источник: Pew Research Center. The Global Religious Landscape
.
Количество последователей ( 15.05.2023 – Countrymeters.info
).
Распределение населения по возрастным группам
Согласно нашим расчётам, по состоянию на начало 2023 года, население Китая имело следующее распределение по возрасту:
| – процент людей младше 15 лет | |
| – процент людей в возрасте от 15 до 65 лет | |
| – процент людей старше 64 лет |
В абсолютных цифрах:
- 256 595 184 человека младше 15 лет (мужчин:
138 218 261 / женщин: 118 376 923) - 1 073 168 362 человека старше 14 и младше 65 лет (мужчин:
551 530 836 / женщин: 521 652 115) - 129 158 356 человек старше 64 лет (мужчин:
62 018 770 / женщин: 67 139 586)
Мы подготовили упрощенную модель возрастно- половой пирамиды, в которой представлены только три возрастные группы, данные о которых были приведены выше:
| 65+ |
| 15-64 |
| 0-14 |
| мужчины | женщины |
Примечание: Масштаб пирамиды отличается от абсолютных значений, приведённых выше, поскольку в каждой возрастной группе содержится разное количество лет.
Как мы видим, возрастная пирамида Китая имеет регрессивный или убывающий тип. Такой тип пирамиды обычно встречается у высоко развитых стран.
В таких странах обычно достаточно высокий уровень здравоохранения, как и уровень образования граждан.
Вследствии относительно низкой смертности и рождаемости, население имеет высокую ожидаемую продолжительность жизни.
Все эти факторы, наряду с множестом других, приводят к старению населения (повышают средний возраст населения).
Источник: Данные этой секции основаны на последних публикациях Департамента Статистики ООН в области демографической и социальной статистики
.
Коэффициент демографической нагрузки
Коэффициент демографической нагрузки показывает нагрузку на общество и экономику со стороны населения, не относящегося к трудоспособному населению (зависимая часть населения).
Под населением, не относящимся к трудоспособному населению понимают суммарное население младше 15 лет и население старше 64 лет.
Возраст населения трудоспособного возраста (производительная часть населения), соответственно, между 15 и 65 годами.
Коэффициент демографической нагрузки напрямую отражает финансовые разходы на социальную политику в государстве.
Например, при увеличении данного коэффициента, должны быть увеличены расходы на постройку образовательных учреждений, социальную защиту, здравоохранение, выплаты пенсий и т.д.
Общий коэффициент нагрузки
Общий коэффициент демографической нагрузки рассчитывается как отношение зависимой части населения к трудоспособной или производительной части населения.
Для Китая Коэффициент общей демографической нагрузки равен 35.9 %.
Значение в 35.9 % – относительно низкое.
Оно показывает, что численность трудоспособного населения более чем в два раза превышает численность населения нетрудоспособного возраста.
Такое отношение создаёт относительно низкую социальную нагрузку для общества.
Коэффициент потенциального замещения
Коэффициент потенциального замещения (коэффициент детской нагрузки) рассчитывается как отношение численности населения ниже трудоспособного возраста к численности трудоспособного населения.
Коэффициент потенциального замещения для Китая равен 23.9 %.
Коэффициент пенсионной нагрузки
Коэффициент пенсионной нагрузки рассчитывается как отношение численности населения выше трудоспособного возраста к численности трудоспособного населения.
Коэффициент пенсионной нагрузки в в Китае составляет 12 %.
Источник: Данные этой секции основаны на последних публикациях Департамента Статистики ООН в области демографической и социальной статистики
.
Ожидаемая продолжительность жизни
Ожидаемая продолжительность жизни это один из наиболее важных демографических показателей.
Он показывает среднее количество лет предстоящей жизни человека.
То есть количество лет, которое теоретически может прожить человек, при условии, что текущие показатели рождаемости и смертности будут оставаться неизменными на протяжении всей жизни человека.
Как правило, под “ожидаемой продолжительностью жизни” понимают ожидаемую продолжительность жизни при рождении, то есть в возрасте 0 лет.
Средняя ожидаемая продолжительность жизни при рождении (для обоих полов) в Китае составляет 74.7 лет (года).
Это выше средней ожидаемой продолжительности жизни в мире, которая находится на уровне около 71 года
(по данным отдела народонаселения Департамента ООН по экономическим и социальным вопросам).
Средняя ожидаемая продолжительность жизни мужчин при рождении – 72.7 лет (года).
Средняя ожидаемая продолжительность жизни женщин при рождении – 76.9 лет (года).
Грамотность населения
По нашим подсчётам в Китае около 1 158 599 776 человек старше 15 лет могут читать и писать на каком- либо языке. Это составляет 96.36% от общего числа взрослого населения.
Под взрослым населением в данном случае подразумеваются все люди старше 15 лет.
Соответственно, около 43 741 531 человек все ещё остаются безграмотными.
Уровень грамотности среди мужского взрослого населения составляет 98.17% (602 309 377 человек).
11 240 229 человек – безграмотны.
Уровень грамотности среди женского взрослого населения составляет 94.48% (556 290 399 человек).
32 501 302 человека – безграмотны.
Уровень грамотности среди молодёжи 99.74% и 99.71% для мужчин и женщин соответственно.
Общий уровень грамотности среди молодёжи составляет 99.73%.
Понятие молодёжи в данном случае покрывает население в возрасте от 15 до 24 лет включительно.
Источник: Данные для раздела “Грамотность населения Китая”
основаны на последних данных, опубликованных Институтом Статистики ЮНЕСКО (данные были взяты 13 марта 2016)
.
История населения Китая (1951 – 2023)
Данные показаны на 1 января соответствующего года.
История населения Китая
| Год | Население | Прирост населения |
|---|---|---|
| 1951 | 562 227 845 | N/A % |
| 1952 | 576 277 413 | 2.50 % |
| 1953 | 588 015 529 | 2.04 % |
| 1954 | 598 248 906 | 1.74 % |
| 1955 | 607 684 698 | 1.58 % |
| 1956 | 616 827 315 | 1.50 % |
| 1957 | 626 058 719 | 1.50 % |
| 1958 | 635 526 239 | 1.51 % |
| 1959 | 645 295 009 | 1.54 % |
| 1960 | 655 338 249 | 1.56 % |
| 1961 | 665 723 712 | 1.58 % |
| 1962 | 676 573 499 | 1.63 % |
| 1963 | 688 271 156 | 1.73 % |
| 1964 | 701 334 864 | 1.90 % |
| 1965 | 716 302 393 | 2.13 % |
| 1966 | 733 391 706 | 2.39 % |
| 1967 | 752 580 907 | 2.62 % |
| 1968 | 773 386 671 | 2.76 % |
| 1969 | 795 120 374 | 2.81 % |
| 1970 | 816 882 494 | 2.74 % |
| 1971 | 838 267 499 | 2.62 % |
| 1972 | 859 179 465 | 2.49 % |
| 1973 | 879 567 854 | 2.37 % |
| 1974 | 899 052 782 | 2.22 % |
| 1975 | 917 425 602 | 2.04 % |
| 1976 | 934 508 081 | 1.86 % |
| 1977 | 950 350 831 | 1.70 % |
| 1978 | 965 107 181 | 1.55 % |
| 1979 | 979 226 061 | 1.46 % |
| 1980 | 993 148 855 | 1.42 % |
| 1981 | 1 007 112 978 | 1.41 % |
| 1982 | 1 021 042 833 | 1.38 % |
| 1983 | 1 035 249 712 | 1.39 % |
| 1984 | 1 050 344 694 | 1.46 % |
| 1985 | 1 066 952 246 | 1.58 % |
| 1986 | 1 085 381 562 | 1.73 % |
| 1987 | 1 105 641 426 | 1.87 % |
| 1988 | 1 126 968 949 | 1.93 % |
| 1989 | 1 148 125 607 | 1.88 % |
| 1990 | 1 167 696 672 | 1.70 % |
| 1991 | 1 184 956 288 | 1.48 % |
| 1992 | 1 199 842 003 | 1.26 % |
| 1993 | 1 212 813 901 | 1.08 % |
| 1994 | 1 224 464 582 | 0.96 % |
| 1995 | 1 235 515 079 | 0.90 % |
| 1996 | 1 246 307 636 | 0.87 % |
| 1997 | 1 256 858 672 | 0.85 % |
| 1998 | 1 267 030 223 | 0.81 % |
| 1999 | 1 276 787 766 | 0.77 % |
| 2000 | 1 286 057 488 | 0.73 % |
| 2001 | 1 294 875 513 | 0.69 % |
| 2002 | 1 303 274 793 | 0.65 % |
| 2003 | 1 311 360 565 | 0.62 % |
| 2004 | 1 319 215 340 | 0.60 % |
| 2005 | 1 326 962 119 | 0.59 % |
| 2006 | 1 334 623 877 | 0.58 % |
| 2007 | 1 342 232 440 | 0.57 % |
| 2008 | 1 349 802 384 | 0.56 % |
| 2009 | 1 357 400 678 | 0.56 % |
| 2010 | 1 365 021 409 | 0.56 % |
| 2011 | 1 372 685 709 | 0.56 % |
| 2012 | 1 380 373 083 | 0.56 % |
| 2013 | 1 388 076 421 | 0.56 % |
| 2014 | 1 395 699 763 | 0.55 % |
| 2015 | 1 403 181 303 | 0.54 % |
| 2016 | 1 410 468 287 | 0.52 % |
| 2017 | 1 417 564 227 | 0.50 % |
| 2018 | 1 424 362 022 | 0.48 % |
| 2019 | 1 430 740 957 | 0.45 % |
| 2020 | 1 436 568 870 | 0.41 % |
| 2021 | 1 443 981 565 | 0.52 % |
| 2022 | 1 451 432 510 | 0.52 % |
| 2023 | 1 458 921 902 | 0.52 % |
Все данные в этой таблице даны на 1 января соответствующего года.
Прогноз численности населения (2020-2100)
| Год | Население | Прирост населения |
|---|---|---|
| 2020 | 1 424 548 268 | N/A % |
| 2025 | 1 438 835 692 | 1.00 % |
| 2030 | 1 441 181 819 | 0.16 % |
| 2035 | 1 433 508 878 | -0.53 % |
| 2040 | 1 417 472 817 | -1.12 % |
| 2045 | 1 394 361 017 | -1.63 % |
| 2050 | 1 364 456 729 | -2.14 % |
| 2055 | 1 328 500 915 | -2.64 % |
| 2060 | 1 288 706 549 | -3.00 % |
| 2065 | 1 248 117 942 | -3.15 % |
| 2070 | 1 208 908 828 | -3.14 % |
| 2075 | 1 171 509 623 | -3.09 % |
| 2080 | 1 135 754 215 | -3.05 % |
| 2085 | 1 102 475 454 | -2.93 % |
| 2090 | 1 072 518 595 | -2.72 % |
| 2095 | 1 045 800 900 | -2.49 % |
| 2100 | 1 020 665 209 | -2.40 % |
Данные даны на 1 июля соответствующего года (средний вариант прогноза).
Источник : Департамент по экономическим и социальным вопросам ООН: Отдел народонаселения
This article is about the demographics of the People’s Republic of China. For the demographics of the Republic of China (Taiwan), see Demographics of Taiwan.
| Demographics of China | |
|---|---|

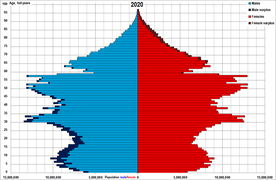
Population pyramid of China in November 2020 |
|
| Population | |
| Growth rate | |
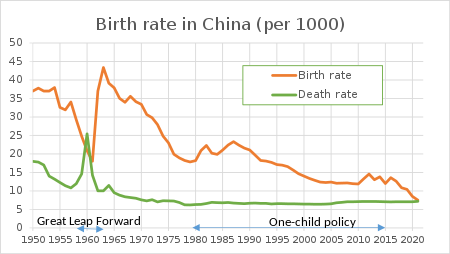
| Birth rate | 6.77 births per 1,000 (2022 est.) |
| Death rate | 7.37 deaths per 1,000 (2022 est.) |
| Life expectancy | |
| • male | |
| • female | |
| Fertility rate | 1.08 children per woman (2022 est.) |
| Infant mortality rate | 6.76 deaths per 1000 live births (2022)[1] |
| Age structure | |
| 0–14 years | 17.29% (2020 est.) |
| 15–64 years | 70.37% (2020 est.) |
| 65 and over | 12.34% (2020 est.) |
| Sex ratio | |
| At birth | 1.11 male to female (2020 est.) |
| 65 and over | 0.90 male to female (2020 est.) |
| Nationality | |
| Nationality | noun: Chinese adjective: Chinese |
| Major ethnic | Han Chinese |
| Minor ethnic | Zhuang, Manchu, Hui, Miao, Uyghurs, Yi, Tujia, Mongols, Tibetan, Bouyei, Dong, Yao, Korean, Bai, Hani, Li, Kazakh, Dai, She, Lisu, Gelao, Lahu, Dongxiang, Va, Sui, Nakhi, Qiang, Tu, Xibe, Mulao, Kyrgyz, Daur, Jingpo, Salar, Blang, Maonan, Tajik, Pumi, Achang, Nu, Ewenki, Gin, Jino, De’ang, Uzbeks, Russian, Yugur, Bonan, Monba, Oroqen, Derung, Tatars, Hezhen, Lhoba |
| Language | |
| Official | Standard Chinese |
| Spoken | Various; See Languages of China |
China is the second most populous country in Asia as well as the second most populous country in the world with a population of 1,411,750,000.
The demographics of China show an enormous population with a relatively small youth component, partially a result of China’s one-child policy that was implemented from 1979 until 2015.
China was the world’s most populous country from at least 1950 until being surpassed by India in 2023.[2][3]
As of December 2022, China’s population stood at 1.4118 billion.[4] According to the 2020 census, 91.11% of the population was Han Chinese, and 8.89% were minorities. China’s population growth rate is only 0.03%, ranking 159th in the world.[5] China conducted its sixth national population census in 2010,[6][7] and its seventh census was completed in late 2020, with data released in May 2021.[8] Unless otherwise indicated, the statistics on this page pertain to mainland China only; see also Demographics of Hong Kong, Demographics of Macau and Demographics of Taiwan.
History[edit]
|
This section needs expansion. You can help by adding to it. (February 2022) |
China’s population reached 1 billion in 1982, the first country to do so.[9]
Population[edit]
Historical population[edit]

Historical population in China from 400 BC[10]

Historical population of India and China since 1100 with projection to 2100
During 1960–2015, the population grew to nearly 1.4 billion. Under Mao Zedong, China nearly doubled in population from 540 million in 1949 to 969 million in 1979. This growth slowed because of the one-child policy instituted in 1979.[10] The 2022 data shows a declining population for the first time since 1961.[11]

Population pyramid of China from 1950 to 2022

Census data[edit]
| Period | Year | Households[citation needed] | Population[citation needed] | Modern estimate (population)[10] | Share of world population[citation needed] |
|---|---|---|---|---|---|
| Warring States | −400 | 18,600,000 | 7.97% | ||
| Western Han | −200 | 23,900,000 | 7.97% | ||
| 1 | 5,366,470 | 32,000,000 | 33,400,000 | 9.11% | |
| Eastern Han | 156 | 6,500,000 | 40,068,856 | 42,000,000 | 10.1% |
| 200 | 38,500,000 | 8.88% | |||
| Western Jin | 280 | 6,801,000 | 8,200,000 | 43,000,000 | 9.35% |
| 300 | 41,700,000 | 8.94% | |||
| Sixteen Kingdoms | 400 | 45,500,000 | 9.1% | ||
| Northern and Southern dynasties | 500 | 50,000,000 | 9.4% | ||
| Sui | 600 | 8,700,000 | 44,500,000 | 55,600,000 | 9.81% |
| Tang | 700 | 6,156,141 | 37,140,001 | 62,500,000 | 10.42% |
| 755 | 8,914,709 | 52,919,309 | 90,000,000 | 15% | |
| 800 | 2,375,805 | 15,762,431 | 71,500,000 | 11.92% | |
| 900 | 83,400,000 | 13.9% | |||
| Northern Song | 1000 | 6,864,160 | 14,278,040 | 100,000,000 | 16.67% |
| 1100 | 19,960,812 | 44,914,491 | 130,000,000 | 21.67% | |
| Southern Song | 1200 | 170,000,000 | 28.33% | ||
| Yuan | 1290 | 13,196,206 | 58,834,711 | 120,000,000 | 20% |
| 1351 | 27,650,000 | 87,587,000 | 180,000,000 | 30% | |
| Ming | 1393 | 10,699,399 | 58,323,934 | 110,000,000 | 18.33% |
| 1400 | 11,415,829 | 66,598,339 | 120,000,000 | 20% | |
| 1500 | 10,508,935 | 60,105,835 | 150,000,000 | 25% | |
| 1550 | 10,621,436 | 60,692,856 | 175,000,000 | 29.17% | |
| 1600 | 197,000,000 | 32.83% | |||
| Qing | 1650 | 123,000,000 | 140,000,000 | 21.54% | |
| 1700 | 126,110,000 | 160,000,000 | 22.86% | ||
| 1750 | 181,810,000 | 225,000,000 | 25.85% | ||
| 1800 | 332,181,400 | 330,000,000 | 33% | ||
| 1850 | 430,000,000 | 436,100,000 | 33.55% | ||
| 1900 | 400,000,000 | 400,000,000 | 23.5% | ||
| Republic of China | 1928 | 474,780,000 | 474,780,000 | 23.82% | |
| People’s Republic of China | 1950 | 546,815,000 | 552,000,000 | 22% | |
| 1975 | 916,395,000 | 920,940,000 | 23% | ||
| 1982 | 1,008,180,000 | 1,022,250,000 | 22% | ||
| 2000 | 1,262,645,000 | 1,283,190,000 | 21% | ||
| 2005 | 1,303,720,000 | 1,321,620,000 | 20% | ||
| 2010 | 1,337,825,000 | 1,359,760,000 | 20% | ||
| 2015 | 1,374,620,000 | 1,397,030,000 | 19% | ||
| 2020 | 1,411,778,724 | 1,447,084,648 | 17.8% |
Censuses in China[edit]
The People’s Republic of China conducted censuses in 1953, 1964, 1982, 1990, 2000, and 2010. In 1987, the government announced that the fourth national census would take place in 1990 and that there would be one every ten years thereafter. The 1982 census (which reported a total population of 1,008,180,738) is generally accepted as significantly more reliable, accurate, and thorough than the previous two.[12] Various international organizations eagerly assisted the Chinese in conducting the 1982 census, including the United Nations Fund for Population Activities, which donated US$100.0 million between 1980-1989 for a variety of projects, one of which being the 1982 census.[13]
China has been the world’s most populous nation for many centuries.[14] When China took its first post-1949 census in 1953, the population stood at 583 million; by the fifth census in 2000, the population had more than doubled, reaching 1.2 billion.
By the sixth census in 2020, the total population had reached to 1,419,933,142, with the mainland having 1,411,778,724, Hong Kong having 7,474,200, and Macau having 683,218. However, this number is disputed by obstetrics researcher Yi Fuxian, who argues that data related to population growth is inflated by local governments to obtain financial subsidies from the central government.[15]
Population of China by age and sex (demographic pyramid)[edit]
-

China population pyramid as of 1st National Census day on June 30, 1953
-

China population pyramid as of 2nd National Census day on July 1, 1964
-

China population pyramid as of 3rd National Census day on July 1, 1982
-
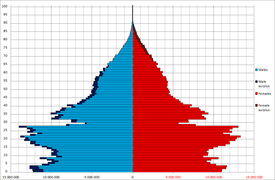
China population pyramid as of 4th National Census day on July 1, 1990
-
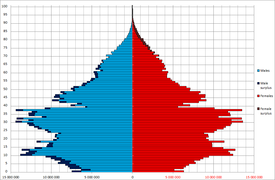
China population pyramid as of 5th National Census day on November 1, 2000
-

China population pyramid as of 6th National Census day on November 1, 2010
-
China population pyramid as of 7th National Census day on November 1, 2020
-

China population pyramid as projected of 8th National Census day on November 1, 2030, in scenario of constant TFR at 2021 level and continued improvements in mortality
| Province or autonomous region |
Census 1953 | Census 1964 | Census 1982 | Census 1990 | Census 2000 | Census 2010 | Census 2020 | |||||||
|---|---|---|---|---|---|---|---|---|---|---|---|---|---|---|
| number | % | number | % | number | % | number | % | number | % | number | % | number | % | |
| Beijing Municipality | 3,768,149 | 1.48 | 8,568,495 | 1.23 | 9,230,687 | 3.92 | 11,819,407 | 0.95 | 13,820,000 | 1.09 | 19,612,368 | 1.46 | 21,893,095 | 1.55 |
| Hebei | 35,984,644 | 6.18 | 49,687,781 | 6.58 | 53,005,876 | 5.26 | 61,082,439 | 5.39 | 67,440,000 | 5.33 | 79,854,202 | 5.36 | 74,610,235 | 5.28 |
| Tianjin Municipality | 2,693,831 | 0.46 | 7,764,141 | 0.77 | 8,785,402 | 0.77 | 10,010,000 | 0.79 | 12,938,224 | 0.97 | 13,866,009 | 0.98 | ||
| Shanxi | 14,314,485 | 2.46 | 18,015,067 | 2.59 | 25,291,389 | 2.51 | 28,759,014 | 2.54 | 32,970,000 | 2.60 | 35,712,111 | 2.67 | 34,915,616 | 2.47 |
| Inner Mongolia Autonomous Region | 6,100,104 | 1.05 | 12,348,638 | 1.78 | 19,274,279 | 1.91 | 21,456,798 | 1.89 | 23,760,000 | 1.88 | 24,706,321 | 1.84 | 24,049,155 | 1.70 |
| Rehe (now defunct) | 5,160,822 | 0.89 | ||||||||||||
| Liaoning | 18,545,147 | 3.18 | 26,946,200 | 3.88 | 35,721,693 | 3.54 | 39,459,697 | 3.48 | 42,380,000 | 3.35 | 43,746,323 | 3.27 | 42,591,407 | 3.02 |
| Jilin | 11,290,073 | 1.94 | 15,668,663 | 2.26 | 22,560,053 | 2.24 | 24,658,721 | 2.18 | 27,280,000 | 2.16 | 27,462,297 | 2.05 | 24,073,453 | 1.71 |
| Heilongjiang | 11,897,309 | 2.04 | 20,118,271 | 2.90 | 32,665,546 | 3.24 | 35,214,873 | 3.11 | 39,890,000 | 2.91 | 38,312,224 | 2.86 | 31,850,088 | 2.26 |
| Shanghai Municipality | 6,204,417 | 1.06 | 10,816,458 | 1.56 | 11,859,748 | 1.18 | 13,341,896 | 1.18 | 16,740,000 | 1.32 | 23,019,148 | 1.72 | 24,870,895 | 1.76 |
| Jiangsu | 41,252,192 | 7.08 | 44,504,608 | 6.41 | 60,521,114 | 6.00 | 67,056,519 | 5.91 | 74,380,000 | 5.88 | 77,659,903 | 5.87 | 84,748,016 | 6.00 |
| Zhejiang | 22,865,747 | 3.92 | 28,318,573 | 4.08 | 38,884,603 | 3.86 | 41,445,930 | 3.66 | 46,770,000 | 3.69 | 54,426,891 | 4.06 | 64,567,588 | 4.57 |
| Anhui | 30,343,637 | 5.21 | 31,241,657 | 4.50 | 49,665,724 | 4.93 | 56,180,813 | 4.96 | 59,860,000 | 4.73 | 59,500,510 | 4.44 | 61,027,171 | 4.32 |
| Fujian | 13,142,721 | 2.26 | 16,757,223 | 2.41 | 25,931,106 | 2.57 | 30,097,274 | 2.65 | 34,710,000 | 2.74 | 36,894,216 | 2.75 | 41,540,086 | 2.94 |
| Jiangxi | 16,772,865 | 2.88 | 21,068,019 | 3.03 | 33,184,827 | 3.29 | 37,710,281 | 3.33 | 41,400,000 | 3.27 | 44,567,475 | 3.33 | 45,188,635 | 3.20 |
| Shandong | 48,876,548 | 8.39 | 55,519,038 | 7.99 | 74,419,054 | 7.38 | 84,392,827 | 7.44 | 90,790,000 | 7.17 | 95,793,065 | 7.15 | 101,527,453 | 7.19 |
| Henan | 44,214,594 | 7.59 | 50,325,511 | 7.25 | 74,422,739 | 7.38 | 85,509,535 | 7.54 | 92,560,000 | 7.31 | 94,023,567 | 7.02 | 99,365,519 | 7.04 |
| Hubei | 27,789,693 | 4.77 | 33,709,344 | 4.85 | 47,804,150 | 4.74 | 53,969,210 | 4.76 | 60,280,000 | 4.76 | 57,237,740 | 4.27 | 57,752,557 | 4.09 |
| Hunan | 33,226,954 | 5.70 | 37,182,286 | 5.35 | 54,008,851 | 5.36 | 60,659,754 | 5.35 | 64,440,000 | 5.09 | 65,683,722 | 4.90 | 66,444,864 | 4.71 |
| Guangdong | 34,770,059 | 5.97 | 42,800,849 | 6.16 | 59,299,220 | 5.88 | 62,829,236 | 5.54 | 86,420,000 | 6.83 | 104,303,132 | 7.79 | 126,012,510 | 8.93 |
| Hainan | 7,870,000 | 0.62 | 8,671,518 | 0.65 | 10,081,232 | 0.71 | ||||||||
| Guangxi Zhuang Autonomous Region | 19,560,822 | 3.36 | 20,845,017 | 3.00 | 36,420,960 | 3.61 | 42,245,765 | 3.73 | 44,890,000 | 3.55 | 46,026,629 | 3.55 | 50,126,804 | 3.55 |
| Sichuan | 62,303,999 | 10.69 | 67,956,490 | 9.78 | 99,713,310 | 9.89 | 107,218,173 | 9.46 | 83,290,000 | 6.58 | 80,418,200 | 6.00 | 83,674,866 | 5.93 |
| Chongqing Municipality | 30,900,000 | 2.44 | 28,846,170 | 2.15 | 32,054,159 | 2.27 | ||||||||
| Guizhou | 15,037,310 | 2.58 | 17,140,521 | 2.47 | 28,552,997 | 2.83 | 32,391,066 | 2.86 | 35,250,000 | 2.78 | 34,746,468 | 2.59 | 38,562,148 | 2.73 |
| Yunnan | 17,472,737 | 3.00 | 20,509,525 | 2.95 | 32,553,817 | 3.23 | 36,972,610 | 3.26 | 42,880,000 | 3.39 | 45,966,239 | 3.43 | 47,209,277 | 3.34 |
| Tibet Autonomous Region | 1,273,969 | 0.22 | 1,251,225 | 0.18 | 1,892,393 | 0.19 | 2,196,010 | 0.19 | 2,620,000 | 0.21 | 3,002,166 | 0.22 | 3,648,100 | 0.26 |
| Xikang (now defunct) | 3,381,064 | 0.58 | ||||||||||||
| Shaanxi | 15,881,281 | 2.73 | 20,766,915 | 2.99 | 28,904,423 | 2.87 | 32,882,403 | 2.90 | 36,050,000 | 2.85 | 37,327,378 | 2.79 | 39,528,999 | 2.80 |
| Gansu | 12,093,600 | 2.06 | 12,630,569 | 1.82 | 19,569,261 | 1.94 | 22,371,141 | 1.97 | 25,620,000 | 2.02 | 25,575,254 | 1.91 | 25,019,831 | 1.77 |
| Ningxia Hui Autonomous Region | 1,506,200 | 0.26 | 2,107,500 | 0.30 | 3,895,578 | 0.39 | 4,655,451 | 0.41 | 5,620,000 | 0.44 | 6,301,350 | 0.47 | 7,202,654 | 0.51 |
| Qinghai | 1,676,534 | 0.29 | 2,145,604 | 0.31 | 3,895,706 | 0.39 | 4,456,946 | 0.39 | 5,180,000 | 0.41 | 5,626,722 | 0.42 | 5,923,957 | 0.42 |
| Xinjiang Uygur Autonomous Region | 4,873,608 | 0.84 | 7,270,067 | 1.05 | 13,081,681 | 1.30 | 15,155,778 | 1.34 | 19,250,000 | 1.52 | 21,813,334 | 1.63 | 25,852,345 | 1.83 |
| Military personnel | 4,238,210 | 3,199,100 | 2,500,000 | 2,300,000 | 2,000,000 | |||||||||
| Population with permanent residence difficult to define | 4,649,985 | |||||||||||||
| Total China | 582,603,417 | 694,581,759 | 1,008,175,288 | 1,133,682,501 | 1,265,830,000 | 1,339,724,852 | 1,411,778,724 |
In 1982 China conducted its first population census since 1964. It was by far the most thorough and accurate census taken since 1949 and confirmed that China was a nation of more than 1 billion people, or about one-fifth of the world’s population. The census provided demographers with a set of data on China’s age-sex structure, fertility and mortality rates, and population density and distribution. Information was also gathered on minority ethnic groups, urban population, and marital status. For the first time since the People’s Republic of China was founded, demographers had reliable information on the size and composition of the Chinese work force. The nation began preparing for the 1982 census in late 1976. Chinese census workers were sent to the United States and Japan to study modern census-taking techniques and automation. Computers were installed in every provincial-level unit except Tibet and were connected to a central processing system in the Beijing headquarters of the State Statistical Bureau. Pretests and small scale trial runs were conducted and checked for accuracy between 1980 and 1981 in twenty-four provincial-level units. Census stations were opened in rural production brigades and urban neighborhoods. Beginning on 1 July 1982, each household sent a representative to a census station to be enumerated. The census required about a month to complete and employed approximately 5 million census takers.
The 1982 census collected data in nineteen demographic categories relating to individuals and households. The thirteen areas concerning individuals were name, relationship to head of household, sex, age, nationality, registration status, educational level, profession, occupation, status of nonworking persons, marital status, number of children born and still living, and number of births in 1981. The six items pertaining to households were type (domestic or collective), serial number, number of persons, number of births in 1981, number of deaths in 1981, and number of registered persons absent for more than one year. Information was gathered in a number of important areas for which previous data were either extremely inaccurate or simply nonexistent, including fertility, marital status, urban population, minority ethnic groups, sex composition, age distribution, and employment and unemployment.
A fundamental anomaly in the 1982 statistics was noted by some Western analysts. They pointed out that although the birth and death rates recorded by the census and those recorded through the household registration system were different, the two systems arrived at similar population totals. The discrepancies in the vital rates were the result of the underreporting of both births and deaths to the authorities under the registration system; families would not report some births because of the one-child policy and would not report some deaths so as to hold on to the rations of the deceased.
Nevertheless, the 1982 census was a watershed for both Chinese and world demographics. After an eighteen-year gap, population specialists were given a wealth of reliable, up-to-date figures on which to reconstruct past demographic patterns, measure current population conditions, and predict future population trends. For example, Chinese and foreign demographers used the 1982 census age-sex structure as the base population for forecasting and making assumptions about future fertility trends. The data on age-specific fertility and mortality rates provided the necessary base-line information for making population projections. The census data also were useful for estimating future manpower potential, consumer needs, and utility, energy, and health-service requirements. The sudden abundance of demographic data helped population specialists immeasurably in their efforts to estimate world population. Previously, there had been no accurate information on these 21% of the Earth’s inhabitants. Demographers who had been conducting research on global population without accurate data on the Chinese fifth of the world’s population were particularly thankful for the 1982 breakthrough census.
Population control[edit]
Initially, China’s post-1949 leaders were ideologically disposed to view a large population as an asset. But the liabilities of a large, rapidly growing population soon became apparent. For one year, starting in August 1956, vigorous support was given to the Ministry of Public Health’s mass birth control efforts. These efforts, however, had little impact on fertility. After the interval of the Great Leap Forward, Chinese leaders again saw rapid population growth as an obstacle to development, and their interest in birth control revived. In the early 1960s, schemes somewhat more muted than during the first campaign, emphasized the virtues of late marriage. Birth control offices were set up in the central government and some provincial-level governments in 1964. The second campaign was particularly successful in the cities, where the birth rate was cut in half during the 1963–66 period. The upheaval of the Cultural Revolution brought the program to a halt, however.
In 1972 and 1973 the party mobilized its resources for a nationwide birth control campaign administered by a group in the State Council. Committees to oversee birth control activities were established at all administrative levels and in various collective enterprises. This extensive and seemingly effective network covered both the rural and the urban population. In urban areas public security headquarters included population control sections. In rural areas the country’s “barefoot doctors” distributed information and contraceptives to people’s commune members. By 1973 Mao Zedong was personally identified with the family planning movement, signifying a greater leadership commitment to controlled population growth than ever before. Yet until several years after Mao’s death in 1976, the leadership was reluctant to put forth directly the rationale that population control was necessary for economic growth and improved living standards.[citation needed]
Population growth targets were set for both administrative units and individual families. In the mid-1970s the maximum recommended family size was two children in cities and three or four in the country. Since 1979 the government has advocated a one-child limit for both rural and urban areas and has generally set a maximum of two children in special circumstances. As of 1986 the policy for minority nationalities was two children per couple, three in special circumstances, and no limit for ethnic groups with very small populations. The overall goal of the one-child policy was to keep the total population within 1.2 billion through the year 2000, on the premise that the Four Modernizations program would be of little value if population growth was not brought under control.
The one-child policy was a highly ambitious population control program. Like previous programs of the 1960s and 1970s, the one-child policy employed a combination of public education, social pressure, and in some cases coercion. The one-child policy was unique, however, in that it linked reproduction with economic cost or benefit.
Under the one-child program, a sophisticated system rewarded those who observed the policy and penalized those who did not. Through this policy, the rate of increasing population was tempered after the penalties were made. Couples with only one child were given a “one-child certificate” entitling them to such benefits as cash bonuses, longer maternity leave, better child care, and preferential housing assignments. In return, they were required to pledge that they would not have more children. In the countryside, there was great pressure to adhere to the one-child limit. Because the rural population accounted for approximately 60% of the total, the effectiveness of the one-child policy in rural areas was considered the key to the success or failure of the program as a whole.
In rural areas the day-to-day work of family planning was done by cadres at the team and brigade levels who were responsible for women’s affairs and by health workers. The women’s team leader made regular household visits to keep track of the status of each family under her jurisdiction and collected information on which women were using contraceptives, the methods used, and which had become pregnant. She then reported to the brigade women’s leader, who documented the information and took it to a monthly meeting of the commune birth-planning committee. According to reports, ceilings or quotas had to be adhered to; to satisfy these cutoffs, unmarried young people were persuaded to postpone marriage, couples without children were advised to “wait their turn,” women with unauthorized pregnancies were pressured to have abortions, and those who already had children were urged to use contraception or undergo sterilization. Couples with more than one child were exhorted[by whom?] to be sterilized.[citation needed]
The one-child policy enjoyed much greater success in urban than in rural areas. Even without state intervention, there were compelling reasons for urban couples to limit the family to a single child. Raising a child required a significant portion of family income, and in the cities a child did not become an economic asset until he or she entered the work force at age sixteen. Couples with only one child were given preferential treatment in housing allocation. In addition, because city dwellers who were employed in state enterprises received pensions after retirement, the sex of their first child was less important to them than it was to those in rural areas.[citation needed]
Numerous reports surfaced of coercive measures used to achieve the desired results of the one-child policy. The alleged methods ranged from intense psychological pressure to the use of physical force, including some grisly accounts of forced abortions and infanticide. Chinese officials admitted that isolated, uncondoned abuses of the program occurred and that they condemned such acts, but they insisted that the family planning program was administered on a voluntary basis using persuasion and economic measures only. International reaction to the allegations were mixed. The UN Fund for Population Activities and the International Planned Parenthood Federation were generally supportive of China’s family planning program. The United States Agency for International Development, however, withdrew US$10 million from the Fund in March 1985 based on allegations that coercion had been used.
Observers suggested that an accurate assessment of the one-child program would not be possible until all women who came of childbearing age in the early 1980s passed their fertile years. As of 1987 the one-child program had achieved mixed results. In general, it was very successful in almost all urban areas but less successful in rural areas.[citation needed]
Rapid fertility reduction associated with the one-child policy has potentially negative results. For instance, in the future the elderly might not be able to rely on their children to care for them as they have in the past, leaving the state to assume the expense, which could be considerable. Based on United Nations and Chinese government statistics, it was estimated in 1987 that by 2000 the population 60 years and older (the retirement age is 60 in urban areas) would number 127 million, or 10.1% of the total population; the projection for 2025 was 234 million elderly, or 16.4%. According to projections based on the 1982 census, if the one-child policy were maintained to the year 2000, 25% of China’s population would be age 65 or older by 2040. In 2050, the number of people over 60 is expected to increase to 430 million.[18] Even though China has already opened two-child policy since 2016, data shows that the second-child policy cannot stop the problem of an aging population. China needs to find an appropriate birth policy to optimize the demographic dividend, which refers to the proportion of labor-age population.[19] On the other hand, the higher house prices squeeze the marriage in China. The house price plays an important role on the influence of marriage and fertility. The increasing house price leads to the lower marriage rate and cause the other serious social problems in China. For the rapid reduction of marriage and fertility, the central government should establish the policy to deal with the high house price.[20]
Population density and distribution[edit]
China is the most populated country in the world and its national population density (137/km2) is very similar to those of countries like Denmark (excluding Greenland) or the Czech Republic. However, the overall population density of China conceals major regional variations. In 2002, about 94% of the population lived east of the Heihe–Tengchong Line; although this eastern area comprises only 43% of China’s total land area, its population density, at roughly 280/km2, is comparable to that of Japan.
Broadly speaking, the population was concentrated east of the mountains[which?] and south of the northern steppe. The most densely populated areas included the Yangtze River Valley (of which the delta region was the most populous), Sichuan Basin, North China Plain, Pearl River Delta, and the industrial area around the city of Shenyang in the northeast.
Population is most sparse in the mountainous, desert, and grassland regions of the northwest and southwest. In Inner Mongolia Autonomous Region, portions are completely uninhabited, and only a few sections have populations denser than ten people per km2. The Inner Mongolia, Xinjiang, and Tibet autonomous regions and Qinghai and Gansu comprise 55% of the country’s land area but in 1985 contained only 5.7% of its population.
| Area (km2) | Population | Density | ||
|---|---|---|---|---|
| China | 9,650,000 (100%) | 1,411,778,724 (100%) | 134.7/km2 | |
| 5 provinces | 5,246,400 (54.45%) | 84,493,388 (5.98%) | 15.16/km2 | |
| Inner Mongolia | 1,183,000 (12.28% ) | 24,049,155 (1.70%) | 20.33/km2 | |
| Xinjiang | 1,660,000 (17.23%) | 25,852,345 (1.83%) | 12.62/km2 | |
| Tibet | 1,228,400 (12.75%) | 3,648,100 (0.26%) | 2.31/km2 | |
| Qinghai | 721,000 (7.48%) | 5,923,957 (0.42%) | 7.65/km2 | |
| Gansu | 454,000 (4.71%) | 25,019,831 (1.77%) | 57.65/km2 | |
| Other provinces | 4,403,605 (45.55%) | 1,327,285,336 (94.02%) | 277.27/km2 | |
| Source: National Bureau of Statistics |
Vital statistics[edit]
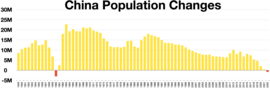
China population changes 1949 – 2022
Table of births and deaths 1949–2022[edit]
China’s fertility statistics differ depending on the source. According to the Ministry of Health and Family Planning November 2015 announcement, China’s 2015 Total Fertility Rate or TFR was somewhere between 1.5 and 1.6.[21][22]
| Midyear population | Live births1 | Deaths1 | Natural change1 | Crude birth rate (per 1000) | Crude death rate (per 1000) | Natural change (per 1000) | Total fertility rate | |
|---|---|---|---|---|---|---|---|---|
| 1949 | 537,371,000 | 19,345,000 | 10,747,000 | 8,598,000 | 36.0 | 20.0 | 16.0 | |
| 1950 | 546,815,000 | 20,232,000 | 9,843,000 | 10,389,000 | 37.0 | 18.0 | 19.0 | 5.29 |
| 1951 | 557,480,000 | 21,073,000 | 9,923,000 | 11,150,000 | 37.8 | 17.8 | 20.0 | |
| 1952 | 568,910,000 | 21,050,000 | 9,671,000 | 11,379,000 | 37.0 | 17.0 | 20.0 | |
| 1953 | 581,390,000 | 21,511,000 | 8,139,000 | 13,372,000 | 37.0 | 14.0 | 23.0 | |
| 1954 | 595,310,000 | 22,604,000 | 7,846,000 | 14,758,000 | 37.97 | 13.18 | 24.79 | |
| 1955 | 608,655,000 | 19,842,000 | 7,474,000 | 12,368,000 | 32.60 | 12.28 | 20.32 | 5.98 |
| 1956 | 621,465,000 | 19,825,000 | 7,085,000 | 12,740,000 | 31.90 | 11.40 | 20.50 | |
| 1957 | 637,405,000 | 21,691,000 | 6,884,000 | 14,807,000 | 34.03 | 10.80 | 23.23 | |
| 1958 | 653,235,000 | 19,088,000 | 7,826,000 | 11,262,000 | 29.22 | 11.98 | 17.24 | |
| 1959 | 666,005,000 | 16,504,000 | 9,717,000 | 6,787,000 | 24.78 | 14.59 | 10.19 | |
| 1960 | 667,070,000 | 13,915,000 | 16,964,000 | −3,049,000 | 20.86 | 25.43 | −4.57 | 3.99 |
| 1961 | 660,330,000 | 11,899,000 | 9,403,000 | 2,496,000 | 18.02 | 14.24 | 3.78 | |
| 1962 | 665,770,000 | 24,640,000 | 6,671,000 | 17,969,000 | 37.01 | 10.02 | 26.99 | |
| 1963 | 682,335,000 | 29,593,000 | 6,851,000 | 22,742,000 | 43.37 | 10.04 | 33.33 | |
| 1964 | 698,355,000 | 27,334,000 | 8,031,000 | 19,303,000 | 39.14 | 11.50 | 27.64 | |
| 1965 | 715,185,000 | 27,091,000 | 6,794,000 | 20,297,000 | 37.88 | 9.50 | 28.38 | 6.02 |
| 1966 | 735,400,000 | 25,776,000 | 6,494,000 | 19,282,000 | 35.05 | 8.83 | 26.22 | |
| 1967 | 754,550,000 | 25,625,000 | 6,361,000 | 19,264,000 | 33.96 | 8.43 | 25.53 | |
| 1968 | 774,510,000 | 27,565,000 | 6,359,000 | 21,206,000 | 35.59 | 8.21 | 27.38 | |
| 1969 | 796,025,000 | 27,152,000 | 6,392,000 | 20,760,000 | 34.11 | 8.03 | 26.08 | |
| 1970 | 818,315,000 | 27,356,000 | 6,219,000 | 21,137,000 | 33.43 | 7.60 | 25.83 | 5.75 |
| 1971 | 841,105,000 | 25,780,000 | 6,157,000 | 19,623,000 | 30.65 | 7.32 | 23.33 | |
| 1972 | 862,030,000 | 25,663,000 | 6,560,000 | 19,103,000 | 29.77 | 7.61 | 22.16 | |
| 1973 | 881,940,000 | 24,633,000 | 6,209,000 | 18,424,000 | 27.93 | 7.04 | 20.89 | |
| 1974 | 900,350,000 | 22,347,000 | 6,609,000 | 15,738,000 | 24.82 | 7.34 | 17.48 | |
| 1975 | 916,395,000 | 21,086,000 | 6,708,000 | 14,378,000 | 23.01 | 7.32 | 15.69 | 3.58 |
| 1976 | 930,685,000 | 18,530,000 | 6,747,000 | 11,783,000 | 19.91 | 7.25 | 12.66 | |
| 1977 | 943,455,000 | 17,860,000 | 6,482,000 | 11,378,000 | 18.93 | 6.87 | 12.06 | |
| 1978 | 956,165,000 | 17,450,000 | 5,976,000 | 11,474,000 | 18.25 | 6.25 | 12.00 | |
| 1979 | 969,005,000 | 17,268,000 | 6,018,000 | 11,250,000 | 18.21 | 6.21 | 11.87 | |
| 1980 | 981,235,000 | 17,868,000 | 6,221,000 | 11,647,000 | 18.21 | 6.34 | 11.87 | 2.32 |
| 1981 | 993,885,000 | 20,782,000 | 6,321,000 | 14,461,000 | 20.91 | 6.36 | 14.55 | |
| 1982 | 1,008,630,000 | 21,260,000 | 6,653,000 | 14,607,000 | 22.28 | 6.60 | 15.68 | |
| 1983 | 1,023,310,000 | 18,996,000 | 7,223,000 | 11,773,000 | 20.19 | 6.90 | 13.29 | |
| 1984 | 1,036,825,000 | 18,022,000 | 6,890,000 | 11,132,000 | 19.90 | 6.82 | 13.08 | |
| 1985 | 1,051,040,000 | 21,994,000 | 7,087,000 | 14,907,000 | 21.04 | 6.78 | 14.26 | 2.65 |
| 1986 | 1,066,790,000 | 23,928,000 | 7,318,000 | 16,610,000 | 22.43 | 6.86 | 15.57 | |
| 1987 | 1,084,035,000 | 25,291,000 | 7,285,000 | 18,006,000 | 23.33 | 6.72 | 16.61 | |
| 1988 | 1,101,630,000 | 24,643,000 | 7,315,000 | 17,328,000 | 22.37 | 6.64 | 15.73 | |
| 1989 | 1,118,650,000 | 24,140,000 | 7,316,000 | 16,824,000 | 21.58 | 6.54 | 15.04 | |
| 1990 | 1,135,185,000 | 23,910,000 | 7,570,000 | 16,340,000 | 21.06 | 6.67 | 14.39 | 2.43 |
| 1991 | 1,150,780,000 | 22,650,000 | 7,710,000 | 14,940,000 | 19.68 | 6.70 | 12.98 | |
| 1992 | 1,164,970,000 | 21,250,000 | 7,740,000 | 13,510,000 | 18.24 | 6.64 | 11.60 | |
| 1993 | 1,178,440,000 | 21,320,000 | 7,820,000 | 13,500,000 | 18.09 | 6.64 | 11.45 | |
| 1994 | 1,191,835,000 | 21,100,000 | 7,740,000 | 13,360,000 | 17.70 | 6.49 | 11.21 | |
| 1995 | 1,204,855,000 | 20,630,000 | 7,920,000 | 12,710,000 | 17.12 | 6.57 | 10.55 | 1.68 |
| 1996 | 1,217,550,000 | 20,670,000 | 7,990,000 | 12,680,000 | 16.98 | 6.56 | 10.42 | |
| 1997 | 1,230,075,000 | 20,380,000 | 8,010,000 | 12,370,000 | 16.57 | 6.51 | 10.06 | |
| 1998 | 1,241,935,000 | 19,420,000 | 8,070,000 | 11,350,000 | 15.64 | 6.50 | 9.14 | |
| 1999 | 1,252,735,000 | 18,340,000 | 8,090,000 | 10,250,000 | 14.64 | 6.46 | 8.18 | |
| 2000 | 1,262,645,000 | 17,710,000 | 8,140,000 | 9,570,000 | 14.03 | 6.45 | 7.58 | 1.45 |
| 2001 | 1,271,850,000 | 17,020,000 | 8,180,000 | 8,840,000 | 13.38 | 6.43 | 6.95 | |
| 2002 | 1,280,400,000 | 16,470,000 | 8,210,000 | 8,260,000 | 12.86 | 6.41 | 6.45 | |
| 2003 | 1,288,400,000 | 15,990,000 | 8,250,000 | 7,740,000 | 12.41 | 6.40 | 6.01 | |
| 2004 | 1,296,075,000 | 15,930,000 | 8,320,000 | 7,610,000 | 12.29 | 6.42 | 5.87 | |
| 2005 | 1,303,720,000 | 16,170,000 | 8,490,000 | 7,680,000 | 12.40 | 6.51 | 5.89 | 1.51 |
| 2006 | 1,311,020,000 | 15,850,000 | 8,930,000 | 6,920,000 | 12.09 | 6.81 | 5.28 | 1.50 |
| 2007 | 1,317,885,000 | 15,940,000 | 9,130,000 | 6,810,000 | 12.10 | 6.93 | 5.17 | 1.53 |
| 2008 | 1,324,655,000 | 16,080,000 | 9,350,000 | 6,730,000 | 12.14 | 7.06 | 5.08 | 1.55 |
| 2009 | 1,331,260,000 | 15,910,000 | 9,430,000 | 6,480,000 | 11.95 | 7.08 | 4.87 | 1.54 |
| 2010 | 1,337,705,000 | 15,920,000 | 9,510,000 | 6,410,000 | 11.90 | 7.11 | 4.79 | 1.54 |
| 2011 | 1,345,035,000 | 17,970,000 | 9,600,000 | 8,370,000 | 13.27 | 7.14 | 6.13 | |
| 2012 | 1,354,190,000 | 19,730,000 | 9,660,000 | 10,070,000 | 14.57 | 7.13 | 7.43 | |
| 2013 | 1,363,240,000 | 17,760,000 | 9,720,000 | 8,040,000 | 13.03 | 7.13 | 5.9 | |
| 2014 | 1,371,860,000 | 18,970,000 | 9,770,000 | 9,200,000 | 13.83 | 7.12 | 6.71 | |
| 2015 | 1,379,860,000 | 16,550,000 | 9,750,000 | 6,800,000 | 11.99 | 7.07 | 4.93 | 1.57 |
| 2016 | 1,387,790,000 | 17,860,000 | 9,770,000 | 8,090,000 | 12.95 | 7.09 | 5.86 | 1.70 |
| 2017 | 1,396,215,000 | 17,230,000 | 9,860,000 | 7,370,000 | 12.64 | 7.06 | 5.58 | 1.67 |
| 2018 | 1,402,760,000 | 15,230,000 | 9,930,000 | 5,300,000 | 10.86 | 7.08 | 3.78 | 1.55 |
| 2019 | 1,407,745,000 | 14,650,000 | 9,980,000 | 4,670,000 | 10.41 | 7.09 | 3.32 | 1.50 |
| 2020 | 1,411,100,000 | 12,020,000 | 9,970,000 | 2,050,000 | 8.52 | 7.07 | 1.45 | 1.30 |
| 2021 | 1,412,360,000 | 10,620,000 | 10,140,000 | 480,000 | 7.52 | 7.18 | 0.34 | 1.16 |
| 2022 | 1,411,800,000 | 9,560,000 | 10,410,000 | −850,000 | 6.77 | 7.37 | −0.60 | 1.08 |
Total fertility rate from 1930 to 1949[edit]
Children born per woman from 1930 to 1949. It is based on fairly good data for the entire period. Sources: Our World In Data and Gapminder Foundation.[22]
| Years | 1930 | 1931 | 1932 | 1933 | 1934 | 1935 | 1936 | 1937 | 1938 | 1939 | 1940[22] |
|---|---|---|---|---|---|---|---|---|---|---|---|
| Total fertility rate in China | 5.5 | 5.47 | 5.45 | 5.43 | 5.4 | 5.38 | 5.35 | 5.32 | 5.3 | 5.28 | 5.25 |
| Years | 1941 | 1942 | 1943 | 1944 | 1945 | 1946 | 1947 | 1948 | 1949[22] |
|---|---|---|---|---|---|---|---|---|---|
| Total fertility rate in China | 5.15 | 5.06 | 4.96 | 4.86 | 4.77 | 5 | 5.2 | 4.91 | 5.54 |
Structure of the population[edit]
Population by Sex and Age Group (Census 01.XI.2010):[23]
| Age Group | Male | Female | Total | % |
|---|---|---|---|---|
| Total | 682 329 104 | 650 481 765 | 1 332 810 869 | 100 |
| 0–4 | 41 062 566 | 34 470 044 | 75 532 610 | 5.67 |
| 5–9 | 38 464 665 | 32 416 884 | 70 881 549 | 5.32 |
| 10–14 | 40 267 277 | 34 641 185 | 74 908 462 | 5.62 |
| 15–19 | 51 904 830 | 47 984 284 | 99 889 114 | 7.49 |
| 20–24 | 64 008 573 | 63 403 945 | 127 412 518 | 9.56 |
| 25–29 | 50 837 038 | 50 176 814 | 101 013 852 | 7.58 |
| 30–34 | 49 521 822 | 47 616 381 | 97 138 203 | 7.29 |
| 35–39 | 60 391 104 | 57 634 855 | 118 025 959 | 8.86 |
| 40–44 | 63 608 678 | 61 145 286 | 124 753 964 | 9.36 |
| 45–49 | 53 776 418 | 51 818 135 | 105 594 553 | 7.92 |
| 50–54 | 40 363 234 | 38 389 937 | 78 753 171 | 5.91 |
| 55–59 | 41 082 938 | 40 229 536 | 81 312 474 | 6.10 |
| 60–64 | 29 834 426 | 28 832 856 | 58 667 282 | 4.40 |
| 65-69 | 20 748 471 | 20 364 811 | 41 113 282 | 3.08 |
| 70-74 | 16 403 453 | 16 568 944 | 32 972 397 | 2.47 |
| 75-79 | 11 278 859 | 12 573 274 | 23 852 133 | 1.79 |
| 80-84 | 5 917 502 | 7 455 696 | 13 373 198 | 1.00 |
| 85-89 | 2 199 810 | 3 432 118 | 5 631 928 | 0.42 |
| 90-94 | 530 872 | 1 047 435 | 1 578 307 | 0.12 |
| 95-99 | 117 716 | 252 263 | 369 979 | 0.03 |
| 100+ | 8 852 | 27 082 | 35 934 | <0.01 |
| Age group | Male | Female | Total | Percent |
| 0–14 | 119 794 508 | 101 528 113 | 221 322 621 | 16.61 |
| 15–64 | 505 329 061 | 487 232 029 | 992 561 090 | 74.47 |
| 65+ | 57 205 535 | 61 721 623 | 118 927 158 | 8.92 |
Life expectancy[edit]

Life expectancy in China since 1930
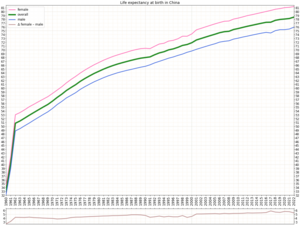
Life expectancy in China since 1960 by gender
Source: UN World Population Prospects[24]
| Period | Life expectancy in Years |
Period | Life expectancy in Years |
|---|---|---|---|
| 1950–1955 | 43.8 | 1985–1990 | 68.9 |
| 1955–1960 | 44.5 | 1990–1995 | 69.7 |
| 1960–1965 | 44.6 | 1995–2000 | 70.9 |
| 1965–1970 | 55.5 | 2000–2005 | 73.1 |
| 1970–1975 | 61.7 | 2005–2010 | 74.7 |
| 1975–1980 | 65.5 | 2010–2015 | 75.7 |
| 1980–1985 | 67.8 |
Fertility and mortality[edit]

In 1949 crude death rates were probably higher than 30 per 1,000, and the average life expectancy was only 35 years. Beginning in the early 1950s, mortality steadily declined; it continued to decline through 1978 and remained relatively constant through 1987. One major fluctuation was reported in a computer reconstruction of China’s population trends from 1953 to 1987 produced by the United States Bureau of the Census. The computer model showed that the crude death rate increased dramatically during the famine years associated with the Great Leap Forward (1958–60).
According to Chinese government statistics, the crude birth rate followed five distinct patterns from 1949 to 1982. It remained stable from 1949 to 1954, varied widely from 1955 to 1965, experienced fluctuations between 1966 and 1969, dropped sharply in the late 1970s, and increased from 1980 to 1981. Between 1970 and 1980, the crude birth rate dropped from 33.4 per 1,000 to 18.2 per 1,000. The government attributed this dramatic decline in fertility to the wǎn xī shǎo (“晚、稀、少”, or “late, long, few”: later marriages, longer intervals between births, and fewer children) birth control campaign. However, elements of socioeconomic change, such as increased employment of women in both urban and rural areas and reduced infant mortality (a greater percentage of surviving children would tend to reduce demand for additional children), may have played some role. The birth rate increased in the 1980s to a level over 20 per 1,000, primarily as a result of a marked rise in marriages and first births. The rise was an indication of problems with the one-child policy of 1979. Chinese sources, however, indicate that the birth rate started to decrease again in the 1990s and reached a level of around 12 per 1,000 in recent years.
In urban areas, the housing shortage may have been at least partly responsible for the decreased birth rate. Also, the policy in force during most of the 1960s and the early 1970s of sending large numbers of high school graduates to the countryside deprived cities of a significant proportion of persons of childbearing age and undoubtedly had some effect on birth rates (see Cultural Revolution (1966–76)). Primarily for economic reasons, rural birth rates tended to decline less than urban rates. The right to grow and sell agricultural products for personal profit and the lack of an old-age welfare system were incentives for rural people to produce many children, especially sons, for help in the fields and for support in old age. Because of these conditions, it is unclear to what degree education had been able to erode traditional values favoring large families.
China exhibits a serious gender imbalance. Census data obtained in 2000 revealed that 119 boys were born for every 100 girls, and among China’s “floating population” the ratio was as high as 128:100. These situations led the government in July 2004 to ban selective abortions of female fetuses. It is estimated that this imbalance will rise until 2025–2030 to reach 20% then slowly decrease.[25]
China now has an increasingly aging population; it is projected that 11.8% of the population in 2020 will be 65 years of age and older.[needs update] Health care has improved dramatically in China since 1949. Major diseases such as cholera, typhoid, and scarlet fever have been brought under control. Life expectancy has more than doubled, and infant mortality has dropped significantly. On the negative side, the incidence of cancer, cerebrovascular disease, and heart disease has increased to the extent that these have become the leading causes of death. Economic reforms initiated in the late 1970s fundamentally altered methods of providing health care; the collective medical care system has been gradually replaced by a more individual-oriented approach.
In 2018, China had the lowest birth rate since 1961, with an estimated of 15.23 million babies being born. The birth figure was 11.6 percent lower compared with 17,23 million in 2017.[26] Officials had expected 21-23 million births in 2018, much more than the 15.23 that occurred. James Liang, an economics professor at Peking University, stated that the apparent birth peak was in 2016, and predicted that birth rates will continue to fall dramatically and that the birthrate will not be higher than 2018 for at least 100 years.[27]
In Hong Kong, the birth rate of 0.9% is lower than its death rate. Hong Kong’s population increases because of immigration from the mainland and a large expatriate population comprising about 4%.[clarification needed] Like Hong Kong, Macau also has a low birth rate and relies on immigration to maintain its population.
Total fertility rate[edit]
According to the 2000 census, the TFR was 1.22 (0.86 for cities, 1.08 for towns and 1.43 for villages/outposts). Beijing had the lowest TFR at 0.67, while Guizhou had the highest at 2.19. The Xiangyang district of Jiamusi city (Heilongjiang) has a TFR of 0.41, which is the lowest TFR recorded anywhere in the world in recorded history. Other extremely low TFR counties are: 0.43 in the Heping district of Tianjin city (Tianjin), and 0.46 in the Mawei district of Fuzhou city (Fujian). At the other end TFR was 3.96 in Geji County (Tibet), 4.07 in Jiali County (Tibet), and 5.47 in Baqing County (Tibet).[28]
The 2010 census reported a TFR of 1.18 (0.88 in cities, 1.15 in townships, and
1.44 in rural areas).[29]
The five regions with the lowest fertility rates were Beijing (0.71), Shanghai
(0.74), Liaoning (0.74), Heilongjiang (0.75), and Jilin (0.76). The five regions with the highest
fertility rates were Guangxi (1.79), Guizhou (1.75), Xinjiang (1.53), Hainan (1.51), and Anhui
(1.48).[29]
Total fertility rate by ethnic group (2010 census): Han (1.14), Zhuang (1.59), Hui (1.48), Manchu (1.18), Uyghur (2.04), Miao (1.82), Yi (1.82), Tujia (1.74), Tibetan (1.60), Mongols (1.26).[30]
The 2020 census reported a TFR of 1.3, but some experts believe that after adjusting for the transient effects of the relaxation of restrictions, China’s actual TFR is as low as 1.1.[31]
Labor force[edit]
In 2012, for the first time, according to the National Bureau of Statistics in January 2013, the number of people theoretically able to enter the Chinese labor force (individuals aged 15 to 59), shrank slightly to 937.27 million, a decrease of 3.45 million from 2011. This trend, resulting from a demographic transition, is anticipated to continue until at least 2030.[32]
The World Factbook estimated the 2019 active labor force was 774.71 million.[33]
Height and weight[edit]
As of 2020, the average Chinese man was 169.7 centimeters tall (5 ft 7 in) in 2019, the figures showed, and women’s average height was 158 centimeters (5 ft 2.2 in). The same study showed an average Chinese man weighed 69.6 kilograms (153.4 lbs, or 11 stone 0 lbs), up 3.4 kilograms (7.5 lbs) over 10 years, while women were 1.7 kilograms (3.8 pounds) heavier on average at 59 kilograms (130.1 pounds, or 9 stone 4.1 lbs). They were up 1.2 centimeters (0.47 in) and 0.8 centimeters (0.31 in) respectively from 5 years earlier.[34][35]
Gender balance[edit]
Future challenges for China will be the gender disparity. According to the 2020 census, males account for 51.24% of China’s 1.41 billion people, while females made up 48.76% of the total. The sex ratio (the number of males for each female in a population) at birth was 118.06 boys to every 100 girls (54.14%) in 2010, higher than the 116.86 (53.89%) of 2000, but 0.53 points lower than the ratio of 118.59 (54.25%) in 2005.[36] In most Western countries the sex ratio at birth is around 105 boys to 100 girls (51.22%).
Ethnic groups[edit]
The People’s Republic of China (PRC) officially recognizes 56 distinct ethnic groups, the largest of which are Han, who constitute 91.51% of the total population in 2010. Ethnic minorities constitute 8.49% or 113.8 million of China’s population in 2010. During the past decades ethnic minorities have experienced higher growth rates than the majority Han population, because they are not under the one-child policy. Their proportion of the population in China has grown from 6.1% in 1953, to 8.04% in 1990, 8.41% in 2000, and 8.49% in 2010. Large ethnic minorities (data according to the 2000 census) include the Zhuang (16 million, 1.28%), Manchu (10 million, 0.84%), Uyghur (9 million, 0.78%), Hui (9 million, 0.71%), Miao (8 million, 0.71%), Yi (7 million, 0.61%), Tujia (5.75 million, 0.63%), Mongols (5 million, 0.46%), Tibetan (5 million, 0.43%), Buyei (3 million, 0.23%), and Korean (2 million, 0.15%). Over 126,000 Westerners from Canada, the US and Europe are living in Mainland China.[37] Almost 1% of people living in Hong Kong are Westerners.
| Ethnic group | Language family | 1953 | % | 1964 | % | 1982 | % | 1990 | % | 2000 | % | 2010[38] | % | 2020[39][40] | % |
|---|---|---|---|---|---|---|---|---|---|---|---|---|---|---|---|
| Han | Sino-Tibetan | 547,283,057 | 93.94 | 651,296,368 | 94.22 | 936,703,824 | 93.30 | 1,039,187,548 | 91.92 | 1,137,386,112 | 91.53 | 1,220,844,520 | 91.60 | 1,286,310,000 | 91.11 |
| Minority groups | 35,320,360 | 6.06 | 39,883,909 | 5.78 | 67,233,254 | 6.67 | 90,570,743 | 8.01 | 105,225,173 | 8.47 | 111,966,349 | 8.40 | 125,470,000 | 8.89 | |
| Zhuang | Tai-Kadai | 6,611,455 | 1.13 | 8,386,140 | 1.21 | 13,441,900 | 1.32 | 15,555,820 | 1.38 | 16,178,811 | 1.28 | 16,926,381 | 1.27 | 19,568,546 | 1.39 |
| Uyghurs | Turkic | 3,640,125 | 0.62 | 3,996,311 | 0.58 | 5,917,030 | 0.59 | 7,207,024 | 0.64 | 8,399,393 | 0.66 | 10,069,346 | 0.76 | 11,774,538 | 0.84 |
| Hui | Sino-Tibetan | 3,559,350 | 0.61 | 4,473,147 | 0.64 | 7,207,780 | 0.71 | 8,612,001 | 0.76 | 9,816,802 | 0.78 | 10,586,087 | 0.79 | 11,377,914 | 0.81 |
| Miao | Hmong-Mien | 2,511,339 | 0.43 | 2,782,088 | 0.40 | 5,017,260 | 0.50 | 7,383,622 | 0.65 | 8,940,116 | 0.71 | 9,426,007 | 0.71 | 11,067,929 | 0.79 |
| Manchu | Tungusic | 2,418,931 | 0.42 | 2,695,675 | 0.39 | 4,299,950 | 0.43 | 9,846,776 | 0.87 | 10,682,263 | 0.84 | 10,387,958 | 0.78 | 10,423,303 | 0.74 |
| Yi | Sino-Tibetan | 3,254,269 | 0.56 | 3,380,960 | 0.49 | 5,492,330 | 0.54 | 6,578,524 | 0.58 | 7,762,286 | 0.61 | 8,714,393 | 0.65 | 9,830,327 | 0.70 |
| Tujia | Sino-Tibetan | 284,900 | 0.03 | 5,725,049 | 0.51 | 8,028,133 | 0.63 | 8,353,912 | 0.63 | 9,587,732 | 0.68 | ||||
| Tibetans | Sino-Tibetan | 2,775,622 | 0.48 | 2,501,174 | 0.36 | 3,821,950 | 0.38 | 4,593,072 | 0.41 | 5,416,021 | 0.43 | 6,282,187 | 0.47 | 7,060,731 | 0.50 |
| Mongols | Mongolic | 1,462,956 | 0.25 | 1,965,766 | 0.28 | 3,402,200 | 0.34 | 4,802,407 | 0.42 | 5,813,947 | 0.46 | 5,981,840 | 0.45 | 6,290,204 | 0.45 |
| Buyei | Tai-Kadai | 1,247,883 | 0.21 | 1,348,055 | 0.19 | 2,103,150 | 0.21 | 2,548,294 | 0.22 | 2,971,460 | 0.23 | 2,870,034 | 0.22 | 3,576,752 | 0.25 |
| Dong | Tai-Kadai | 712802 | 836123 | 1,446,190 | 0.14 | 2,508,624 | 0.22 | 2,960,293 | 0.24 | 2,879,974 | 0.22 | 3,495,993 | 0.25 | ||
| Yao | Hmong-Mien | 665933 | 857265 | 1,414,870 | 0.14 | 2,137,033 | 0.19 | 2,637,421 | 0.21 | 2,796,003 | 0.21 | 3,309,341 | 0.23 | ||
| Bai | Sino-Tibetan | 567119 | 706623 | 1,147,360 | 0.11 | 1,598,052 | 0.14 | 1,858,063 | 0.15 | 1,933,510 | 0.15 | 2,091,543 | 0.15 | ||
| Hani | Sino-Tibetan | 481220 | 628727 | 1,063,300 | 0.11 | 1,254,800 | 0.11 | 1,439,673 | 0.12 | 1,660,932 | 0.12 | 1,733,166 | 0.12 | ||
| Korean | Koreanic | 1,120,405 | 0.19 | 1,339,569 | 0.19 | 1,783,150 | 0.18 | 1,923,361 | 0.17 | 1,923,842 | 0.15 | 1,830,929 | 0.14 | 1,702,479 | 0.12 |
| Li | Tai-Kadai | 360950 | 438813 | 882,030 | 0.09 | 1,112,498 | 0.10 | 1,247,814 | 0.10 | 1,463,064 | 0.11 | 1,602,104 | 0.11 | ||
| Kazakh | Turkic | 509375 | 491637 | 878,570 | 0.09 | 1,110,758 | 0.10 | 1,250,458 | 0.10 | 1,462,588 | 0.11 | 1,562,518 | 0.11 | ||
| Dai | Tai-Kadai | 478966 | 535389 | 864,340 | 0.09 | 1,025,402 | 0.09 | 1,158,989 | 0.09 | 1,261,311 | 0.09 | 1,329,985 | 0.09 | ||
| She | Hmong-Mien | 234167 | 379,080 | 0.04 | 634,700 | 0.06 | 709,592 | 0.06 | 708,651 | 0.05 | |||||
| Lisu | Sino-Tibetan | 317465 | 270628 | 466,760 | 0.05 | 574,589 | 0.05 | 634,912 | 0.05 | 702,839 | 0.05 | ||||
| Gelao | Tai-Kadai | 26852 | 59,810 | 0.01 | 438,192 | 0.04 | 579,357 | 0.05 | 550,746 | 0.04 | |||||
| Dongxiang | Mongolic | 155761 | 147443 | 279523 | – | 373,669 | 0.03 | 513,805 | 0.04 | 621,500 | 0.05 | ||||
| Gaoshan | Austronesian | 329 | 366 | 1,750 | 0.00 | 2,877 | 0.00 | 4,461 | 0.00 | 4,009 | 0.00 | ||||
| Lahu | Sino-Tibetan | 139060 | 191241 | 320,350 | 0.03 | 411,545 | 0.04 | 453,705 | 0.04 | 485,966 | 0.04 | ||||
| Sui | Tai-Kadai | 133566 | 156099 | 300,690 | 0.03 | 347,116 | 0.03 | 406,902 | 0.03 | 411,847 | 0.03 | ||||
| Va | Mon-Khmer | 286158 | 200272 | 271,050 | 0.03 | 351,980 | 0.03 | 396,610 | 0.03 | 429,709 | 0.03 | ||||
| Nakhi | Sino-Tibetan | 143453 | 156796 | 248,650 | 0.02 | 277,750 | 0.02 | 308,839 | 0.02 | 326,295 | 0.02 | ||||
| Qiang | Sino-Tibetan | 35660 | 49105 | 109,760 | 0.01 | 198,303 | 0.02 | 306,072 | 0.02 | 309,576 | 0.02 | ||||
| Tu | Mongolic | 53277 | 77349 | 148,760 | 0.01 | 192,568 | 0.02 | 241,198 | 0.02 | 289,565 | 0.02 | ||||
| Mulao | Tai-Kadai | 52819 | 91,790 | 0.01 | 160,648 | 0.01 | 207,352 | 0.02 | 216,257 | 0.02 | |||||
| Xibe | Tungusic | 19022 | 33438 | 77,560 | 0.01 | 172,932 | 0.02 | 188,824 | 0.02 | 190,481 | 0.01 | ||||
| Kyrgyz | Turkic | 70944 | 70151 | 108,790 | 0.01 | 143,537 | 0.01 | 160,823 | 0.01 | 186,708 | 0.01 | ||||
| Daur | Mongolic | 63394 | 94126 | – | 121,463 | 0.01 | 132,143 | 0.01 | 131,992 | 0.01 | |||||
| Jingpo | Sino-Tibetan | 101852 | 57762 | 100,180 | 0.01 | 119,276 | 0.01 | 132,143 | 0.01 | 147,828 | 0.01 | ||||
| Maonan | Tai-Kadai | 22382 | 37,450 | 0.00 | 72,370 | 0.01 | 107,106 | 0.01 | 101,192 | 0.01 | |||||
| Salar | Turkic | 30658 | 69135 | 68,030 | 0.01 | 82,398 | 0.01 | 104,503 | 0.01 | 130,607 | 0.01 | ||||
| Blang | Mon-Khmer | 39411 | 58473 | – | 87,546 | 0.01 | 91,882 | 0.01 | 119,639 | 0.01 | |||||
| Tajik | Indo-European | 14462 | 16236 | 27,430 | 0.00 | 33,223 | 0.00 | 41,028 | 0.00 | 51,069 | 0.00 | ||||
| Achang | Sino-Tibetan | 12032 | 31,490 | 0.00 | 27,718 | 0.00 | 33,936 | 0.00 | 39,555 | 0.00 | |||||
| Pumi | Sino-Tibetan | 14298 | 18,860 | 0.00 | 29,721 | 0.00 | 33,600 | 0.00 | 42,861 | 0.00 | |||||
| Ewenki | Tungusic | 4957 | 9681 | 19,440 | 0.00 | 26,379 | 0.00 | 30,505 | 0.00 | 30,875 | 0.00 | ||||
| Nu | Sino-Tibetan | 15047 | 25,980 | 0.00 | 27,190 | 0.00 | 28,759 | 0.00 | 37,523 | 0.00 | |||||
| Gin (Vietnamese) | Mon-Khmer | 12,140 | 0.00 | 18,749 | 0.00 | 22,517 | 0.00 | 28,199 | 0.00 | ||||||
| Jino | Sino-Tibetan | 11,260 | 0.00 | 18,022 | 0.00 | 20,899 | 0.00 | 23,143 | 0.00 | ||||||
| De’ang | Mon-Khmer | – | – | 15,461 | 0.00 | 17,935 | 0.00 | 20,556 | 0.00 | ||||||
| Bonan | Mongolic | 4957 | 5125 | 6,620 | 0.00 | 11,683 | 0.00 | 16,505 | 0.00 | 20,074 | 0.00 | ||||
| Russian | Indo-European | 22656 | 1326 | 2,830 | 0.00 | 13,500 | 0.00 | 15,609 | 0.00 | 15,393 | 0.00 | ||||
| Yugur | Turkic | 3861 | 5717 | 7,670 | 0.00 | 12,293 | 0.00 | 13,719 | 0.00 | 14,378 | 0.00 | ||||
| Uzbek | Turkic | 13626 | 7717 | 13,810 | 0.00 | 14,763 | 0.00 | 13,370 | 0.00 | 10,569 | 0.00 | ||||
| Monba | Sino-Tibetan | 3809 | 1,040 | 0.00 | 7,498 | 0.00 | 8,923 | 0.00 | 10,561 | 0.00 | |||||
| Oroqen | Tungusic | 2262 | 2709 | 2,280 | 0.00 | 7,004 | 0.00 | 8,196 | 0.00 | 8,659 | 0.00 | ||||
| Derung | Sino-Tibetan | 4,250 | 0.00 | 5,825 | 0.00 | 7,426 | 0.00 | 6,930 | 0.00 | ||||||
| Chinese Tatars | Turkic | 6929 | 2294 | 7,510 | 0.00 | 5,064 | 0.00 | 4,890 | 0.00 | 3,556 | 0.00 | ||||
| Hezhen | Tungusic | 718 | 670 | 0.00 | 4,254 | 0.00 | 4,640 | 0.00 | 5,354 | 0.00 | |||||
| Lhoba | Sino-Tibetan | 1,030 | 0.00 | 2,322 | 0.00 | 2,965 | 0.00 | 3,682 | 0.00 | ||||||
| Unrecognized | 3,370,880 | 0.33 | 3,498 | 0.00 | 734,379 | 0.06 | 640,101 | 0.05 | |||||||
| Unknown | 4,720 | 0.00 | 752,347 | 0.07 | – | – | – | – | |||||||
| Naturalized | – | – | – | – | 941 | 0.00 | 1,448 | 0.00 | |||||||
| Total China | 582,603,417 | 694,581,759 | 1,008,175,288 | 1,133,682,501 | 1,242,612,226 | 1,332,810,869 | 1,411,778,724 |
Neither Hong Kong nor Macau recognizes the official ethnic classifications maintained by the central government. In Macau, the largest substantial ethnic groups of non-Chinese descent are the Macanese, of mixed Chinese and Portuguese descent (Eurasians), as well as migrants from the Philippines and Thailand. Overseas Filipinos (overwhelmingly female) working as domestic workers comprise the largest non-Han Chinese ethnic group in Hong Kong.
People from other immigration jurisdictions[edit]
The 2020 Census counted 371,380 residents from Hong Kong, 55,732 residents from Macau, 157,886 residents from Taiwan, and 845,697 residents from other locations, totaling 1,430,695 residents.[41][42]
| Nationality | Residents |
|---|---|
| Myanmar | 351,248 |
| Vietnam | 79,212 |
| South Korea | 59,242 |
| United States | 55,226 |
| Japan | 36,838 |
| Canada | 21,309 |
| Australia | 12,777 |
| United Kingdom | 12,513 |
| Germany | 11,236 |
| Laos | 9,496 |
| Other countries | 236,600 |
| TOTAL | 845,697 |
Religions[edit]
| Province | Chinese ancestorism[43] |
Buddhism[51] | Christianity[51] | Islam[52] |
|---|---|---|---|---|
| Fujian | 31.31% | 40.40% | 3.97% | 0.32% |
| Zhejiang | 23.02% | 23.99% | 3.89% | <0.2% |
| Guangxi | 40.48% | 10.23% | 0.15% | <0.2% |
| Guangdong | 43.71% | 5.18% | 0.68% | <0.2% |
| Yunnan | 32.22% | 13.06% | 0.68% | 1.52% |
| Guizhou | 31.18% | 1.86% | 0.49% | 0.48% |
| Jiangsu | 16.67% | 14.17% | 2.67% | <0.2% |
| Jiangxi | 24.05% | 7.96% | 0.66% | <0.2% |
| Shandong | 25.28% | 2.90% | 1.54% | 0.55% |
| Chongqing | 26.63% | 0.85% | 0.28% | <0.2% |
| Hunan | 20.19% | 2.44% | 0.49% | <0.2% |
| Shanxi | 15.61% | 3.65% | 1.55% | <0.2% |
| Henan | 7.94% | 5.52% | 4.95% | 1.05% |
| Jilin | 7.73% | 8.23% | 3.26% | <0.2% |
| Anhui | 4.64% | 7.83% | 4.32% | 0.58% |
| Gansu | 3.51% | 6.85% | 0.28% | 6.64% |
| Heilongjiang | 7.73% | 4.39% | 3.63% | 0.35% |
| Shaanxi | 7.58% | 6.35% | 1.66% | 0.4% |
| Liaoning | 7.73% | 5.31% | 1.99% | 0.64% |
| Sichuan | 10.6% | 2.06% | 0.30% | <0.2% |
| Hubei | 6.5% | 2.09% | 1.71% | <0.2% |
| Hebei | 5.52% | 1.59% | 1.13% | 0.82% |
| Hainan | – | – | 0.48%[43] | <0.2% |
| Beijing | – | 11.2%[54] | 0.78%[43] | 1.76% |
| Shanghai | – | 10.30% | 1.88% | 0.36% |
| Tianjin | – | – | 0.43% | <0.2% |
| Tibet | – | ~78%[55] | – | 0.39% |
| Xinjiang | – | – | 1.0%[43] | 57.99% |
| Ningxia | – | – | 1.17%[43] | 33.99% |
| Qinghai | – | – | 0.76%[43] | 17.51% |
| Inner Mongolia | 2.36% | 12.1%[56] | 2.0%[43] | 0.91% |
| China | 16%[57] | 15%[58][59] | 2.5%[58][59] | 2%[53]: 13 |
Migration[edit]
Internal migration in the People’s Republic of China is one of the most extensive in the world according to the International Labour Organization.[67] In fact, research done by Kam Wing Chan of the University of Washington suggests that “In the 30 years since 1979, China’s urban population has grown by about 440 million to 622 million in 2009. Of the 440 million increase, about 340 million was attributable to net migration and urban reclassification. Even if only half of that increase was migration, the volume of rural-urban migration in such a short period is likely the largest in human history.”[68] Migrants in China are commonly members of a floating population, which refers primarily to migrants in China without local household registration status through the Chinese Hukou system.[69] In general, rural-urban migrant workers are most excluded from local educational resources, citywide social welfare programs and many jobs because of their lack of hukou status.[70]
In 2011 a total of 252.78 million migrant workers (an increase of 4.4% compared to 2010) existed in China. Out of these, migrant workers who left their hometown and worked in other provinces accounted for 158.63 million (an increase of 3.4% compared to 2010) and migrant workers who worked within their home provinces reached 94.15 million (an increase of 5.9% compared to 2010).[71] Estimations are that Chinese cities will face an influx of another 243 million migrants by 2025, taking the urban population up to nearly 1 billion people.[72] This population of migrants would represent “almost 40 percent of the total urban population,” a number which is almost three times the current level.[72][73] While it is often difficult to collect accurate statistical data on migrant floating populations, the number of migrants is undoubtedly quite large. “In China’s largest cities, for instance, it is often quoted that at least one out of every five persons is a migrant.”[74] China’s government influences the pattern of urbanization through the Hukou permanent residence registration system, land-sale policies, infrastructure investment and the incentives offered to local government officials. The other factors influencing migration of people from rural provincial areas to large cities are employment, education, business opportunities and higher standard of living.[75]
The mass emigration known as the Chinese diaspora,[76] which occurred from the 19th century to 1949, was mainly caused by wars and starvation in mainland China, invasion from various foreign countries, as well as the problems resulting from political corruption. Most immigrants were illiterate peasants and manual labourers, called “coolies” by analogy to the same pattern of immigration from India, who emigrated to work in countries such as the Americas, Australia, South Africa and Southeast Asia.
Urbanization[edit]

Urbanization increased in speed following the initiation of the reform and opening policy. By the end of 2014, 54.7% of the total population lived in urban areas, a rate that rose from 26% in 1990.[77]
Demographic statistics[edit]
The following demographic statistics are from the CIA World Factbook, unless otherwise indicated.[78]
No statistics have been included for areas currently governed by the Republic of China (Taiwan). Unless stated otherwise, statistics refer only to mainland China. (See Demographics of Hong Kong and Demographics of Macau.)
- Population
- Mainland only: 1,411,750,000 (2022)
- Hong Kong: 7,276,588 (2015)
- Macau: 635,293 (2015)
- Total: 1,387,096,243 (2015).
- Population rank: 1 (See List of countries by population.)
- Urban-rural ratio
- Urban: 61.4% (2020)
- Rural: 38.6% (2020)
- Age structure

Age pyramid for China. Each box denotes a five-year age group,
starting with 0–5 years in the bottom box.
Effects of the one-child policy result in smaller age cohorts in recent years.
- 0–14 years: 17.29% (male 129,296,339/female 111,782,427)
- 15–24 years: 11.48% (male 86,129,841/female 73,876,148)
- 25–54 years: 46.81% (male 333,789,731/female 318,711,557)
- 55–64 years: 12.08% (male 84,827,645/female 83,557,507)
- 65 years and over: 12.34% (male 81,586,490/female 90,458,292) (2020 est.)
- 0–14 years: 17.2% (2015)
- 15–64 years: 72.0% (2015)
- 65 years and: 10.8% (2015)
- Median age
- total: 38.4 years Country comparison to the world: 62nd
- male: 37.5 years
- female: 38.4 years (2021 est.)
- Population growth rate
- -0.06% (2022 est.) Country comparison to the world: 175th
- Birth rate
- 6.77 births/1,000 population (2022 est.) Country comparison to the world: 169th
- Death rate
- 7.37 deaths/1,000 population (2022 est.) Country comparison to the world: 77th
- Net migration rate
- -0.43 migrant(s)/1,000 population (2021 est.) Country comparison to the world: 122nd
- Population growth rate
- Population growth rate: -0.06% (2022)
- Sex distribution
- Sex distribution: 1.06 males/females (2020)
- Sex ratio
- At birth: 1.11 male(s)/female (2020)
- Under 15 years: 1.16 male(s)/female (2020)
- 15–24 years: 1.17 male(s)/female (2020)
- 25–54 years: 1.02 male(s)/female (2020)
- 65 years and over: 0.9 male(s)/female (2020)
- Total population: 1.06 male(s)/female (2020)
- Infant mortality rate
- Total: 11.5 deaths/1,000 live births (2020 est)
- Male: 11.6 deaths/1,000 live births (2020 est)
- Female: 10.64 deaths/1,000 live births (2020 est)
See Infant mortality in China
- Urbanization
- urban population: 59.2% of total population (2018)
- rate of urbanization: 2.4% annual rate of change (2015–20 est.)
note: data do not include Hong Kong and Macau
- Life expectancy at birth
- Total population: 76.31 years (2021)
- Male: 74.23 years (2021)
- Female: 78.62 years (2021)
- Religious affiliation
- Predominantly: Mahayana Buddhism, Taoism, Confucianism (via ancestral worship).
- Others: Christianity (3–4%), Islam (1.5%), ethnic minority religions, others.
- Note: State atheism, but traditionally pragmatic and eclectic.
Sources:[79][80][81][82]
See also[edit]
- Megalopolises in China
- Metropolitan cities of China
- Demographics of Central Asia
- Demographics of Beijing
- Population history of China
- Secession in China
- Language Atlas of China
Notes[edit]
- ^ Chinese ancestral or lineage religion is the worship of kin’s ancestor-gods in the system of lineage churches and ancestral shrines. It is worthwhile to note that this does not include other forms of Chinese religion, such as the worship of national ancestral gods or the gods of nature (which in northern China is more common than ancestor worship), and Taoism and Confucianism.
- ^ Historical record and contemporary scholarly fieldwork testify certain central and northern provinces of China as hotbeds of folk religious sects and Confucian religious groups.
- ^ The map represents the geographic diffusion of the tradition of folk religious movements of salvation, Confucian churches and jiaohua (“transformative teachings”) movements, based on historical data and contemporary fieldwork. Due to incomplete data and ambiguous identity of many of these traditions the map may not be completely accurate. Sources include a World Religion Map from Harvard University, based on data from the World Religion Database, showing highly unprecise ranges of Chinese folk (salvationist) religions’ membership by province. Another source, the studies of China’s Regional Religious System, find “very high activity of popular religion and secret societies and low Buddhist presence in northern regions, while very high Buddhist presence in the southeast”.[44]
[note 2]
- Hebei: Fieldwork by Thomas David Dubois[45] testifies the dominance of folk religious movements, specifically the Church of the Heaven and the Earth and the Church of the Highest Supreme, since their “energetic revival since the 1970s” (p. 13), in the religious life of the counties of Hebei. Religious life in rural Hebei is also characterised by a type of organisation called the benevolent churches and the salvationist movement known as Zailiism has returned active since the 1990s.
- Henan: According to Heberer and Jakobi (2000)[46] Henan has been for centuries a hub of folk religious sects (p. 7) that constitute significant focuses of the religious life of the province. Sects present in the region include the Baguadao or Tianli (“Order of Heaven”) sect, the Dadaohui, the Tianxianmiaodao, the Yiguandao, and many others. Henan also has a strong popular Confucian orientation (p. 5).
- Northeast China: According to official records by the then-government, the Universal Church of the Way and its Virtue or Morality Society had 8 million members in Manchuria, or northeast China in the 1930s, making up about 25% of the total population of the area (note that the state of Manchuria also included the eastern end of modern-day Inner Mongolia).[47] Folk religious movements of a Confucian nature, or Confucian churches, were in fact very successful in the northeast.
- Shandong: The province is traditionally a stronghold of Confucianism and is the area of origin of many folk religious sects and Confucian churches of the modern period, including the Universal Church of the Way and its Virtue, the Way of the Return to the One (皈依道 Guīyīdào), the Way of Unity (一貫道 Yīguàndào), and others. Alex Payette (2016) testifies the rapid growth of Confucian groups in the province in the 2010s.[48]
According to the Chinese General Social Survey of 2012,[49] about 2.2% of the total population of China (around 30 million people) claims membership in the folk religious sects, which have likely maintained their historical dominance in central-northern and northeastern China.
- ^ The statistics for Chinese ancestorism, that is the worship of ancestor-gods within the lineage system, are from the Chinese Spiritual Life Survey of 2010.[43] The statistics for Buddhism and Christianity are from the China Family Panel Studies survey of 2012.[51] The statistics for Islam are from a survey conducted in 2010.[52] It is worthwhile to note that the populations of Chinese ancestorism and Buddhism may overlap, even with the large remaining parts of the population whose belief is not documented in the table. The latter, the uncharted population, may practise other forms of Chinese religion, such as the worship of gods, Taoism, Confucianism and folk salvationisms, or may be atheist. Indeed, according to the CFPS 2012, only 6.3% of the Chinese were irreligious in the sense of “atheism”, while the rest practised the worship of gods and ancestors.[53]: 13
References[edit]
Citations[edit]
- ^ “Country Comparisons – Infant mortality rate”. The World Factbook. Central Intelligence Agency. 5 May 2022. Retrieved 5 May 2022.
- ^ “Most populous nation: Should India rejoice or panic?”. BBC News. 1 May 2023.
- ^ “India to overtake China as world’s most populous country in April 2023, United Nations projects”. United Nations. 24 April 2023. Retrieved 27 April 2023.
- ^ Qi, Liyan (17 January 2022). “China’s population stalls with births in 2021 the lowest in modern history”. Mint. Archived from the original on 2 February 2022. Retrieved 24 April 2022.
- ^ “China’s population grows 0.034% in 2021, slowest in six decades”. Nikkei Asia. Retrieved 10 April 2022.
- ^ “Tough road ahead for China census”. Straitstimes.com. Archived from the original on 23 October 2010. Retrieved 14 October 2013.
- ^ “Communiqué of the National Bureau of Statistics of People’s Republic of China on Major Figures of the 2010 Population Census (No. 1)”. National Bureau of Statistics of China. 28 April 2011. Archived from the original on 8 November 2013. Retrieved 29 April 2011.
- ^ Wee, Sui-Lee (11 May 2021). “China’s ‘Long-Term Time Bomb’: Falling Births Drive Slow Population Growth”. The New York Times. Archived from the original on 11 May 2021. Retrieved 11 May 2021.
- ^ Weisskopf, Michael (28 October 1982). “China’s Population Passes 1 Billion in Latest Census”. Washington Post. ISSN 0190-8286. Retrieved 14 May 2023.
- ^ a b c Banister, Judith (1992). “A Brief History of China’s Population”. A Brief History of China’s Population, The Population of Modern China. pp. 51–57. doi:10.1007/978-1-4899-1231-2_3. ISBN 978-0-306-44138-7.
- ^ Ng, Kelly (17 January 2023). “China’s population falls for first time since 1961”. BBC News. Retrieved 17 January 2023.
- ^ Xiaogang, He. “The Evolution of Population Census Undertakings in China, 1953–2010”. China Review. 15: 171–206.
- ^ Kaufman, Joan (March 2011). “China Case Study on UNFPA” (PDF). Center for Global Development. p. 19. Archived (PDF) from the original on 26 December 2020.
- ^ “The U.S Census Bureau – China”. www.census.gov. Archived from the original on 5 September 2015. Retrieved 21 April 2021.
- ^ Lee, Jane Lanhee (3 December 2021). “Researcher questions China’s population data, says it may be lower”. Reuters. Retrieved 25 July 2022.
- ^ a b “中华人民共和国国家统计局 >> 人口普查公报”. Stats.gov.cn. Archived from the original on 27 December 2013. Retrieved 14 October 2013.
- ^ “Communiqué of the Seventh National Population Census (No. 3)”. stats.gov.cn. Retrieved 10 August 2021.
- ^ Du, Peng; Yang, Hui (2010). “China’s population ageing and active ageing”. China Journal of Social Work. 3 (2–3): 139–152. doi:10.1080/17525098.2010.492636. S2CID 153569892.
- ^ Wu, Pengkun; Wu, Chong; Wu, Yuanyuan (June 2018). “Reforming Path of China’s Fertility Policy in Stabilizing Demographic Dividends Perspective”. Social Indicators Research. 137 (3): 1225–1243. doi:10.1007/s11205-017-1642-0. ISSN 0303-8300. S2CID 157651164.
- ^ Su, Chi-Wei; Khan, Khalid; Hao, Lin-Na; Tao, Ran; Peculea, Adelina Dumitrescu (1 January 2020). “Do house prices squeeze marriages in China?”. Economic Research-Ekonomska Istraživanja. 33 (1): 1419–1440. doi:10.1080/1331677X.2020.1746190. ISSN 1331-677X. S2CID 219065105.
- ^ “National Bureau of Statistics of China: China Statistical yearbook 2011, chapter 3 Population”. Stats.gov.cn. Retrieved 14 October 2013.
- ^ a b c d Max Roser (2014), “Fertility Rate”, Our World In Data, Gapminder Foundation
- ^ “UNSD — Demographic and Social Statistics”.
- ^ “World Population Prospects – Population Division – United Nations”. Retrieved 15 July 2017.
- ^ “Pascal Rocha da Silva, Projection de la population chinoise 2000–2050, p. 9, cf” (PDF). Archived from the original (PDF) on 11 August 2013. Retrieved 14 October 2013.
- ^ “The number of births in China hit its lowest level since 1961”. archive.fo. 15 February 2019. Archived from the original on 15 February 2019. Retrieved 15 February 2019.
- ^ Kuo, Lily (2 March 2019). “Can China recover from its disastrous one-child policy?”. The Guardian. Retrieved 4 March 2019.
- ^ Terrell, Heather (2005). Fertility in China in 2000: A County Level Analysis (MS thesis). Texas A&M University. hdl:1969.1/3892. Retrieved 14 December 2022.
- ^ a b Wang Guang-zhou; Fu Chong-hui. “New fertility changes and characteristics from the sixth population census in China” (PDF). Iussp.org. Retrieved 31 August 2017.
- ^ Team, Discuz! Team and Comsenz UI. “科学网—2010年人口普查各民族人口数据 – 易富贤的博文”. blog.sciencenet.cn. Retrieved 31 August 2017.
- ^ Toshiya, Tsugami (16 September 2021). “Why Society Will be the Real Loser from China’s Low Birth Rate”. Nippon.com. Retrieved 11 April 2022.
- ^ Jamil Anderliniin; Ed Crooks (19 January 2013). “Chinese Labor Pool Begins to Drain”. CNBC. Financial Times. Retrieved 8 February 2013.
- ^ “CIA World Fact Book”. Cia.gov. Retrieved 19 December 2022.
- ^ “中国男性和女性平均身高分别为169.7厘米和158厘米-中新网”. www.chinanews.com.cn. Retrieved 28 July 2022.
- ^ “China: average body weight of adults by gender 2020”. Statista. Retrieved 28 July 2022.
- ^ “Chinese mainland gender ratios most balanced since 1950s: census data”. News.xinhuanet.com. 28 April 2011. Archived from the original on 11 September 2011. Retrieved 14 October 2013.
- ^ “Expats in China: Nationalities and in which cities they settle”.
- ^ “2-1 全国各民族分年龄、性别的人口” (XLS). Stats.gov.cn. Retrieved 31 August 2017.
- ^ “Main Data of the Seventh National Population Census”. Stats.gov.cn. Retrieved 25 July 2021.
- ^ “China Statistical Yearbook 2021”.
- ^ “Major Figures on Residents from Hong Kong, Macao and Taiwan and Foreigners Covered by 2010 Population Census”. Stats.gov.cn. Archived from the original on 14 May 2011. Retrieved 14 October 2013.
- ^ “在国内的外国人中,哪个国家的人最多?_越南_缅甸_日本”. www.sohu.com. Retrieved 8 May 2023.
- ^ a b c d e f g h i Data from the Chinese Spiritual Life Survey (CSLS) 2010 for Chinese ancestorists, and from the Chinese General Social Survey (CGSS) 2009 for Christians. Reported in Wang, Xiuhua (2015). “Explaining Christianity in China: Why a Foreign Religion has Taken Root in Unfertile Ground” (PDF). Baylor University. p. 15. Archived from the original (PDF) on 25 September 2015.
- ^ Wu, Jiang; Tong, Daoqin. “Spatial Analysis and GIS Modeling of Regional Religious Systems in China” (PDF). University of Arizona. Archived from the original (PDF) on 27 April 2017.
- ^ Dubois (2005).
- ^ Heberer, Thomas; Jakobi, Sabine (2000). “Henan – The Model: From Hegemonism to Fragmentism. Portrait of the Political Culture of China’s Most Populated Province” (PDF). Duisburg Working Papers on East Asian Studies. No. 32.
- ^ Ownby (2008).
- ^ Payette (2016).
- ^ Lu 卢, Yunfeng 云峰 (2014). “卢云峰:当代中国宗教状况报告——基于CFPS(2012)调查数据” [Report on Religions in Contemporary China – Based on CFPS (2012) Survey Data] (PDF). World Religious Cultures (1): 13. Archived from the original (PDF) on 9 August 2014. The report compares the data of the China Family Panel Studies 2012 with those of the Renmin University’s Chinese General Social Survey (CGSS) of the years 2006, 2008, 2010 and 2011.
- ^ “Taoism in China” (Map). Taoism’s incidence by province of China. Archived from the original on 27 April 2017. The map illustrates local religion led by Taoist specialists, forms and institutions.
- ^ a b c d e Data from the China Family Panel Studies (CFPS) 2012. Reported in Gai, Rong Hua; Gao, Jun Hui (22 December 2016). “Multiple-Perspective Analysis on the Geological Distribution of Christians in China”. PEOPLE: International Journal of Social Sciences. 2 (1): 809–817. doi:10.20319/pijss.2016.s21.809817. ISSN 2454-5899.
- ^ a b c Data from Yang, Zongde (2010). “Study on Current Muslim Population in China” (PDF). Jinan Muslim (2). Archived from the original (PDF) on 27 April 2017. Reported in Min, Junqing (2013). “The Present Situation and Characteristics of Contemporary Islam in China” (PDF). JISMOR (8). Archived from the original (PDF) on 24 June 2017. p. 29.
- ^ a b China Family Panel Studies 2012. Reported and compared with Chinese General Social Survey (CGSS) 2006, 2008, 2010 and 2011 in Lu 卢, Yunfeng 云峰 (2014). “卢云峰:当代中国宗教状况报告——基于CFPS(2012)调查数据” [Report on Religions in Contemporary China – Based on CFPS (2012) Survey Data] (PDF). World Religious Cultures (1). Archived from the original (PDF) on 9 August 2014.
- ^ Lai, Hongyi (2016). China’s Governance Model: Flexibility and Durability of Pragmatic Authoritarianism. Routledge. ISBN 978-1317859529. p. 167.
- ^ “Internazional Religious Freedom Report 2012” (PDF). US Government. p. 20, quoting: “Most ethnic Tibetans practice Tibetan Buddhism, although a sizeable minority practices Bon, an indigenous religion, and very small minorities practice Islam, Catholicism, or Protestantism. Some scholars estimate that there are as many as 400,000 Bon followers across the Tibetan Plateau. Scholars also estimate that there are up to 5,000 ethnic Tibetan Muslims and 700 ethnic Tibetan Catholics in the TAR”.
- ^ Wu, Jiayu; Fang, Yong (January 2016). “Study on the Protection of the Lama Temple Heritage in Inner Mongolia as a Cultural Landscape”. Journal of Asian Architecture and Building Engineering. 15 (1): 9–16. doi:10.3130/jaabe.15.9. Archived from the original on 24 September 2017. Note that the article, in an evident mistranslation from Chinese, reports 30 million Tibetan Buddhists in Inner Mongolia instead of 3 million.
- ^ 2010 Chinese Spiritual Life Survey, Purdue University’s Center on Religion and Chinese Society. Data reported in Wenzel-Teuber, Katharina; Strait, David (2012). “People’s Republic of China: Religions and Churches Statistical Overview 2011” (PDF). Religions & Christianity in Today’s China. II (3): 29–54. ISSN 2192-9289. Archived from the original (PDF) on 27 April 2017.
- ^ a b For China Family Panel Studies 2014 survey results see release #1 (archived) and release #2 (archived). The tables also contain the results of CFPS 2012 (sample 20,035) and Chinese General Social Survey (CGSS) results for 2006, 2008 and 2010 (samples ~10.000/11,000). Also see, for comparison CFPS 2012 data in Lu 卢, Yunfeng 云峰 (2014). “卢云峰:当代中国宗教状况报告——基于CFPS(2012)调查数据” [Report on Religions in Contemporary China – Based on CFPS (2012) Survey Data] (PDF). World Religious Cultures (1). Archived from the original (PDF) on 9 August 2014. p. 13, reporting the results of the CGSS 2006, 2008, 2010 and 2011, and their average (fifth column of the first table).
- ^ a b Wenzel-Teuber, Katharina. “Statistics on Religions and Churches in the People’s Republic of China – Update for the Year 2016” (PDF). Religions & Christianity in Today’s China. VII (2): 26–53. Archived from the original (PDF) on 22 July 2017.
- ^ Yao, Xinzhong (May 2007). “Religious Belief and Practice in Urban China 1995-2005”. Journal of Contemporary Religion. 22 (2): 169–185. doi:10.1080/13537900701331031. S2CID 144500936. pp. 169-185.
- ^ 2010 Chinese Spiritual Life Survey, Purdue University’s Center on Religion and Chinese Society. Data reported in Wenzel-Teuber, Katharina; Strait, David (2012). “People’s Republic of China: Religions and Churches Statistical Overview 2011” (PDF). Religions & Christianity in Today’s China. 2 (3): 29–54. ISSN 2192-9289. Archived from the original (PDF) on 27 April 2017.
- ^ “Religion in China on the Eve of the 2008 Beijing Olympics”. Religion and Public Life Project. Pew Research Center. 2008.
- ^ a b China Family Panel Studies 2012. Reported and compared with Chinese General Social Survey (CGSS) 2006, 2008, 2010 and 2011 in Lu 卢, Yunfeng 云峰 (2014). “卢云峰:当代中国宗教状况报告——基于CFPS(2012)调查数据” [Report on Religions in Contemporary China – Based on CFPS (2012) Survey Data] (PDF). World Religious Cultures (1). Archived from the original (PDF) on 9 August 2014.
- ^ Yu Tao (2012). “A Solo, a Duet, or an Ensemble? Analysing the Recent Development of Religious Communities in Contemporary Rural China”. 4th International Forum for Contemporary Chinese Studies. ECRAN – Europe-China Research and Advice Network, University of Nottingham.
- ^ Sun, Shangyang; Li, Ding. “Chinese Traditional Culture Study Fever, Scarcity of Meaning and the Trend of University Students’ Attitudes towards Religions: A Survey in Beijing”. Journal of Sino-Western Studies (2011): 53–68.
- ^ Yang, Fenggang; Tamney, Joseph (2011). Confucianism and Spiritual Traditions in Modern China and Beyond. Brill. ISBN 978-9004212398.. p. 67.
- ^ “Labour migration”. International Labour Organization. Retrieved 20 October 2013.
- ^ Chan, Kam Wing; Peter Bellwood (2011). “China, Internal Migration” (PDF). In Immanuel Ness (ed.). The Encyclopedia of Global Migration. Blackwell Publishing. pp. 1–46. Retrieved 20 October 2013.
- ^ Liang, Zai; Zhongdong Ma (2004). “China’s floating population: new evidence from the 2000 census”. Population and Development Review. 30 (3): 467–488. doi:10.1111/j.1728-4457.2004.00024.x.
- ^ Chan, Kam Wing; Li Zhang (1999). “The Hukou System and Rural-Urban Migration in China: Processes and Changes”. The China Quarterly. 160 (160): 818–855. doi:10.1017/s0305741000001351. PMID 20101805. S2CID 38684915.
- ^ “Statistical Communiqué on the 2011 National Economic and Social Development”. National Bureau of Statistics of China. 2012. Archived from the original on 21 October 2013. Retrieved 6 August 2012.
beneath figure 3
- ^ a b Shanghai, Geoff Dyer in (23 March 2008). “China braced for wave of urban migrants”. Financial Times. ISSN 0307-1766. Archived from the original on 10 December 2022. Retrieved 15 November 2013.
- ^ Woetzel, Jonathan; Lenny Mendonca; Janamitra Devan; Stefano Negri; Yangmei Hu; Luke Jordan; Xiujun Li; Alexander Maasry; Geoff Tsen; Flora Yu (March 2009), Preparing for China’s urban billion, McKinsey Global Institute
- ^ Wang, Feng; Xuejin Zuo (May 1999). “Inside China’s Cities: Institutional Barriers and Opportunities for Urban Migrants”. The American Economic Review. 89 (2): 276–280. doi:10.1257/aer.89.2.276. JSTOR 117120.
- ^ Griffiths, Michael. B. (2010) ‘Lamb Buddha’s Migrant Workers: Self-assertion on China’s Urban Fringe’. Journal of Current Chinese Affairs (China Aktuell), 39, 2, 3–37.
- ^ Goodkind, Daniel. “The Chinese Diaspora: Historical Legacies and Contemporary Trends” (PDF). U.S. Census Bureau. Retrieved 31 August 2021.
- ^ “Chinese urban population 54.77 pct of total”. Xinhua. 20 January 2015. Archived from the original on 19 May 2015.
- ^ “China – The World Factbook”. www.cia.gov. Retrieved 10 February 2021.
- ^ “China – Religion”. Atheism.about.com. 16 December 2009. Archived from the original on 15 May 2013. Retrieved 14 October 2013.
- ^ “CIA Factbook – China”. Cia.gov. Retrieved 14 October 2013.
- ^ “Bureau of East Asian and Pacific Affairs – Background Note: China”. State.gov. 16 August 2013. Retrieved 14 October 2013.
- ^ “Chinese Religions”. Asia.msu.edu. 15 May 2013. Archived from the original on 20 February 2009. Retrieved 14 October 2013.
